Comcast 2014 Annual Report Download - page 69
Download and view the complete annual report
Please find page 69 of the 2014 Comcast annual report below. You can navigate through the pages in the report by either clicking on the pages listed below, or by using the keyword search tool below to find specific information within the annual report.-
 1
1 -
2
-
3
-
4
-
5
-
6
-
7
-
8
-
9
-
10
-
11
-
12
-
13
-
14
-
15
-
16
-
17
-
18
-
19
-
20
-
21
-
22
-
23
-
24
-
25
-
26
-
27
-
28
-
29
-
30
-
31
-
32
-
33
-
34
-
35
-
36
-
37
-
38
-
39
-
40
-
41
-
42
-
43
-
44
-
45
-
46
-
47
-
48
-
49
-
50
-
51
-
52
-
53
-
54
-
55
-
56
-
57
-
58
-
 59
59 -
 60
60 -
 61
61 -
 62
62 -
 63
63 -
 64
64 -
 65
65 -
 66
66 -
 67
67 -
 68
68 -
 69
69 -
 70
70 -
 71
71 -
 72
72 -
 73
73 -
 74
74 -
 75
75 -
 76
76 -
 77
77 -
 78
78 -
 79
79 -
80
-
81
-
82
-
83
-
84
-
85
-
86
-
87
-
88
-
89
-
90
-
91
-
92
-
93
-
94
-
95
-
96
-
97
-
98
-
99
-
100
-
101
-
102
-
103
-
104
-
105
-
106
-
107
-
108
-
109
-
110
-
111
-
112
-
113
-
114
-
115
-
116
-
117
-
118
-
119
-
120
-
121
-
122
-
123
-
124
-
125
-
126
-
127
-
128
-
129
-
130
-
131
-
132
-
133
-
134
-
135
-
136
-
137
-
138
-
139
-
140
-
141
-
142
-
143
-
144
-
145
-
146
-
147
-
148
-
149
-
150
-
151
-
152
-
153
-
154
-
155
-
156
-
157
-
158
-
159
-
160
-
161
-
162
-
163
-
164
-
165
-
166
-
167
-
168
-
169
-
170
-
171
-
172
-
173
-
174
-
175
-
176
-
177
-
178
-
179
-
180
-
181
-
182
-
183
-
184
-
185
-
186
-
187
-
188
-
189
-
190
-
191
-
192
-
193
-
194
-
195
-
196
-
197
-
198
-
199
-
200
-
201
-
202
-
203
-
204
-
205
-
206
-
207
-
208
-
209
-
210
-
211
-
212
-
213
-
214
-
215
-
216
-
217
-
218
-
219
-
220
-
221
-
222
-
223
-
224
-
225
-
226
-
227
-
228
-
229
-
230
-
231
-
232
-
233
-
234
-
235
-
236
-
237
-
238
-
239
-
240
-
241
-
242
-
243
-
244
-
245
-
246
-
247
-
248
-
249
-
250
-
251
-
252
-
253
-
254
-
255
-
256
-
257
-
258
-
259
-
260
-
261
-
262
-
263
-
264
-
265
-
266
-
267
-
268
-
269
-
270
-
271
-
272
-
273
-
274
-
275
-
276
-
277
-
278
-
279
-
280
-
281
-
282
-
283
-
284
-
285
-
286
-
287
-
288
-
289
-
290
-
291
-
292
-
293
-
294
-
295
-
296
-
297
-
298
-
299
-
300
-
301
-
302
-
303
-
304
-
305
-
306
-
307
-
308
-
309
-
310
-
311
-
312
-
313
-
314
-
315
-
316
-
317
-
318
-
319
-
320
-
321
-
322
-
323
-
324
-
325
-
326
-
327
-
328
-
329
-
330
-
331
-
332
-
333
-
334
-
335
-
336
-
337
-
338
-
339
-
340
-
341
-
342
-
343
-
344
-
345
-
346
-
347
-
348
-
349
-
350
-
351
-
352
-
353
-
354
-
355
-
356
-
357
-
358
-
359
-
360
-
361
-
362
-
363
-
364
-
365
-
366
-
367
-
368
-
369
-
370
-
371
-
372
-
373
-
374
-
375
-
376
-
377
-
378
-
379
-
380
-
381
-
382
-
383
-
384
-
385
-
386
 |
 |

Table of Contents
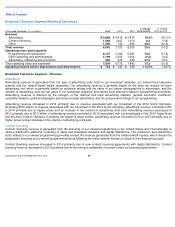
Broadcast Television Segment Results of Operations
Broadcast Television Segment – Revenue
Advertising
Advertising revenue is generated from the sale of advertising units sold on our broadcast networks, our owned local television
stations and our related digital media properties. Our advertising revenue is primarily based on the price we receive for each
advertising unit, which is generally based on audience ratings and the value of our viewer demographics to advertisers, and the
number of advertising units we can place in our broadcast networks’ and owned local television stations’
programming schedules.
Advertising revenue is affected by the strength of the national and local advertising markets, general economic conditions,
cyclicality related to political campaigns and issue-oriented advertising, and the success and ratings of our programming.
Advertising revenue increased in 2014 primarily due to revenue associated with our broadcast of the 2014 Sochi Olympics.
Excluding $730 million of revenue associated with our broadcast of the 2014 Sochi Olympics, advertising revenue increased 4.6%
in 2014 primarily due to higher prices and an increase in the volume of advertising units sold. Advertising revenue decreased in
2013 primarily due to $1.2 billion of advertising revenue recorded in 2012 associated with our broadcasts of the 2012 Super Bowl
and the 2012 London Olympics. Excluding the impact of these events, advertising revenue increased 5.0% in 2013 primarily due to
higher prices and an increase in the volume of advertising units sold.
Content Licensing
Content licensing revenue is generated from the licensing of our owned programming in the United States and internationally to
various distribution platforms, including to cable and broadcast networks and digital distributors. The production and distribution
costs related to our owned programming generally exceed the revenue generated from the initial network license, which means the
subsequent licensing of our owned programming series following the initial network license is critical to their financial success.
Content licensing revenue increased in 2014 primarily due to new content licensing agreements with digital distributors. Content
licensing revenue decreased in 2013 primarily due to the timing of availability of content under our licensing agreements.
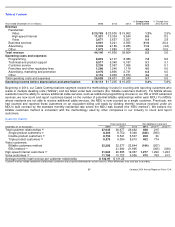
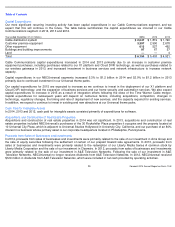
Year ended December 31 (in millions)
2014
2013
2012
% Change
2013 to 2014
% Change
2012 to 2013
Revenue
Advertising
$
5,888
$
4,930
$
5,876
19.4
%
(16.1
)%
Content licensing
1,569
1,447
1,474
8.4
(1.8
)
Other
1,085
743
850
46.0
(12.6
)
Total revenue
8,542
7,120
8,200
20.0
(13.2
)
Operating costs and expenses
Programming and production
6,127
5,192
6,291
18.0
(17.5
)
Other operating and administrative
1,199
1,204
1,206
(0.4
)
(0.2
)
Advertising, marketing and promotion
482
379
345
27.0
10.0
Total operating costs and expenses
7,808
6,775
7,842
15.3
(13.6
)
Operating income before depreciation and amortization
$
734
$
345
$
358
112.5
%
(3.6
)%
Comcast 2014 Annual Report on Form 10
-
K
64