Comcast 2014 Annual Report Download - page 116
Download and view the complete annual report
Please find page 116 of the 2014 Comcast annual report below. You can navigate through the pages in the report by either clicking on the pages listed below, or by using the keyword search tool below to find specific information within the annual report.-
 1
1 -
2
-
3
-
4
-
5
-
6
-
7
-
8
-
9
-
10
-
11
-
12
-
13
-
14
-
15
-
16
-
17
-
18
-
19
-
20
-
21
-
22
-
23
-
24
-
25
-
26
-
27
-
28
-
29
-
30
-
31
-
32
-
33
-
34
-
35
-
36
-
37
-
38
-
39
-
40
-
41
-
42
-
43
-
44
-
45
-
46
-
47
-
48
-
49
-
50
-
51
-
52
-
53
-
54
-
55
-
56
-
57
-
58
-
59
-
60
-
61
-
62
-
63
-
64
-
65
-
66
-
67
-
68
-
69
-
70
-
71
-
72
-
73
-
74
-
75
-
76
-
77
-
78
-
79
-
80
-
81
-
82
-
83
-
84
-
85
-
86
-
87
-
88
-
89
-
90
-
91
-
92
-
93
-
94
-
95
-
96
-
97
-
98
-
99
-
100
-
101
-
102
-
103
-
104
-
105
-
 106
106 -
 107
107 -
 108
108 -
 109
109 -
 110
110 -
 111
111 -
 112
112 -
 113
113 -
 114
114 -
 115
115 -
 116
116 -
 117
117 -
 118
118 -
 119
119 -
 120
120 -
 121
121 -
 122
122 -
 123
123 -
 124
124 -
 125
125 -
 126
126 -
127
-
128
-
129
-
130
-
131
-
132
-
133
-
134
-
135
-
136
-
137
-
138
-
139
-
140
-
141
-
142
-
143
-
144
-
145
-
146
-
147
-
148
-
149
-
150
-
151
-
152
-
153
-
154
-
155
-
156
-
157
-
158
-
159
-
160
-
161
-
162
-
163
-
164
-
165
-
166
-
167
-
168
-
169
-
170
-
171
-
172
-
173
-
174
-
175
-
176
-
177
-
178
-
179
-
180
-
181
-
182
-
183
-
184
-
185
-
186
-
187
-
188
-
189
-
190
-
191
-
192
-
193
-
194
-
195
-
196
-
197
-
198
-
199
-
200
-
201
-
202
-
203
-
204
-
205
-
206
-
207
-
208
-
209
-
210
-
211
-
212
-
213
-
214
-
215
-
216
-
217
-
218
-
219
-
220
-
221
-
222
-
223
-
224
-
225
-
226
-
227
-
228
-
229
-
230
-
231
-
232
-
233
-
234
-
235
-
236
-
237
-
238
-
239
-
240
-
241
-
242
-
243
-
244
-
245
-
246
-
247
-
248
-
249
-
250
-
251
-
252
-
253
-
254
-
255
-
256
-
257
-
258
-
259
-
260
-
261
-
262
-
263
-
264
-
265
-
266
-
267
-
268
-
269
-
270
-
271
-
272
-
273
-
274
-
275
-
276
-
277
-
278
-
279
-
280
-
281
-
282
-
283
-
284
-
285
-
286
-
287
-
288
-
289
-
290
-
291
-
292
-
293
-
294
-
295
-
296
-
297
-
298
-
299
-
300
-
301
-
302
-
303
-
304
-
305
-
306
-
307
-
308
-
309
-
310
-
311
-
312
-
313
-
314
-
315
-
316
-
317
-
318
-
319
-
320
-
321
-
322
-
323
-
324
-
325
-
326
-
327
-
328
-
329
-
330
-
331
-
332
-
333
-
334
-
335
-
336
-
337
-
338
-
339
-
340
-
341
-
342
-
343
-
344
-
345
-
346
-
347
-
348
-
349
-
350
-
351
-
352
-
353
-
354
-
355
-
356
-
357
-
358
-
359
-
360
-
361
-
362
-
363
-
364
-
365
-
366
-
367
-
368
-
369
-
370
-
371
-
372
-
373
-
374
-
375
-
376
-
377
-
378
-
379
-
380
-
381
-
382
-
383
-
384
-
385
-
386
 |
 |

Table of Contents
Comcast Corporation
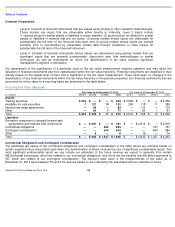
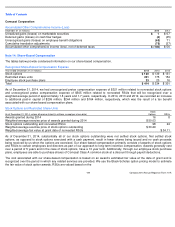
Accumulated Other Comprehensive Income (Loss)
Note 14: Share-Based Compensation
The tables below provide condensed information on our share-based compensation.
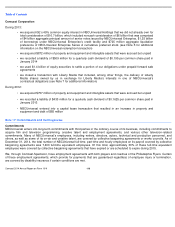
Recognized Share-Based Compensation Expense
As of December 31, 2014, we had unrecognized pretax compensation expense of $321 million related to nonvested stock options
and unrecognized pretax compensation expense of $505 million related to nonvested RSUs that will be recognized over a
weighted
-
average period of approximately 1.8 years and 1.7 years, respectively. In 2014, 2013 and 2012, we recorded an increase
to additional paid-
in capital of $299 million, $244 million and $164 million, respectively, which was the result of a tax benefit
associated with our share-based compensation plans.
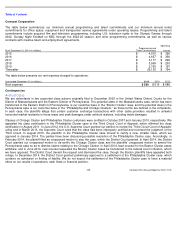
Stock Options and Restricted Share Units
As of December 31, 2014, substantially all of our stock options outstanding were net settled stock options. Net settled stock
options, as opposed to stock options exercised with a cash payment, result in fewer shares being issued and no cash proceeds
being received by us when the options are exercised. Our share-
based compensation primarily consists of awards of stock options
and RSUs to certain employees and directors as part of our approach to long-
term incentive compensation. Awards generally vest
over a period of 5 years and in the case of stock options, have a 10 year term. Additionally, through our employee stock purchase
plans, employees are able to purchase shares of Comcast Class A common stock at a discount through payroll deductions.
The cost associated with our share-based compensation is based on an award’
s estimated fair value at the date of grant and is
recognized over the period in which any related services are provided. We use the Black-
Scholes option pricing model to estimate
the fair value of stock option awards. RSUs are valued based on the
December 31 (in millions)
2014
2013
Unrealized gains (losses) on marketable securities
$
1
$
67
Deferred gains (losses) on cash flow hedges
(4
)
(45
)
Unrecognized gains (losses) on employee benefit obligations
(68
)
71
Cumulative translation adjustments
(75
)
(37
)
Accumulated other comprehensive income (loss), net of deferred taxes
$
(146
)
$
56
Year ended December 31 (in millions)
2014
2013
2012
Stock options
$
160
$
139
$
131
Restricted share units
231
175
154
Employee stock purchase plans
23
20
16
Total
$
414
$
334
$
301
As of December 31, 2014, unless otherwise stated (in millions, except per share data)
Stock
Options
RSUs
Awards granted during 2014
16
8
Weighted
-
average exercise price of awards granted during 2014
$
50.03
Stock options outstanding and nonvested RSUs
98
24
Weighted-average exercise price of stock options outstanding
$
30.29
Weighted-average fair value at grant date of nonvested RSUs
$
34.11
111
Comcast 2014 Annual Report on Form 10-
K