Comcast 2014 Annual Report Download - page 111
Download and view the complete annual report
Please find page 111 of the 2014 Comcast annual report below. You can navigate through the pages in the report by either clicking on the pages listed below, or by using the keyword search tool below to find specific information within the annual report.-
 1
1 -
2
-
3
-
4
-
5
-
6
-
7
-
8
-
9
-
10
-
11
-
12
-
13
-
14
-
15
-
16
-
17
-
18
-
19
-
20
-
21
-
22
-
23
-
24
-
25
-
26
-
27
-
28
-
29
-
30
-
31
-
32
-
33
-
34
-
35
-
36
-
37
-
38
-
39
-
40
-
41
-
42
-
43
-
44
-
45
-
46
-
47
-
48
-
49
-
50
-
51
-
52
-
53
-
54
-
55
-
56
-
57
-
58
-
59
-
60
-
61
-
62
-
63
-
64
-
65
-
66
-
67
-
68
-
69
-
70
-
71
-
72
-
73
-
74
-
75
-
76
-
77
-
78
-
79
-
80
-
81
-
82
-
83
-
84
-
85
-
86
-
87
-
88
-
89
-
90
-
91
-
92
-
93
-
94
-
95
-
96
-
97
-
98
-
99
-
100
-
 101
101 -
 102
102 -
 103
103 -
 104
104 -
 105
105 -
 106
106 -
 107
107 -
 108
108 -
 109
109 -
 110
110 -
 111
111 -
 112
112 -
 113
113 -
 114
114 -
 115
115 -
 116
116 -
 117
117 -
 118
118 -
 119
119 -
 120
120 -
 121
121 -
122
-
123
-
124
-
125
-
126
-
127
-
128
-
129
-
130
-
131
-
132
-
133
-
134
-
135
-
136
-
137
-
138
-
139
-
140
-
141
-
142
-
143
-
144
-
145
-
146
-
147
-
148
-
149
-
150
-
151
-
152
-
153
-
154
-
155
-
156
-
157
-
158
-
159
-
160
-
161
-
162
-
163
-
164
-
165
-
166
-
167
-
168
-
169
-
170
-
171
-
172
-
173
-
174
-
175
-
176
-
177
-
178
-
179
-
180
-
181
-
182
-
183
-
184
-
185
-
186
-
187
-
188
-
189
-
190
-
191
-
192
-
193
-
194
-
195
-
196
-
197
-
198
-
199
-
200
-
201
-
202
-
203
-
204
-
205
-
206
-
207
-
208
-
209
-
210
-
211
-
212
-
213
-
214
-
215
-
216
-
217
-
218
-
219
-
220
-
221
-
222
-
223
-
224
-
225
-
226
-
227
-
228
-
229
-
230
-
231
-
232
-
233
-
234
-
235
-
236
-
237
-
238
-
239
-
240
-
241
-
242
-
243
-
244
-
245
-
246
-
247
-
248
-
249
-
250
-
251
-
252
-
253
-
254
-
255
-
256
-
257
-
258
-
259
-
260
-
261
-
262
-
263
-
264
-
265
-
266
-
267
-
268
-
269
-
270
-
271
-
272
-
273
-
274
-
275
-
276
-
277
-
278
-
279
-
280
-
281
-
282
-
283
-
284
-
285
-
286
-
287
-
288
-
289
-
290
-
291
-
292
-
293
-
294
-
295
-
296
-
297
-
298
-
299
-
300
-
301
-
302
-
303
-
304
-
305
-
306
-
307
-
308
-
309
-
310
-
311
-
312
-
313
-
314
-
315
-
316
-
317
-
318
-
319
-
320
-
321
-
322
-
323
-
324
-
325
-
326
-
327
-
328
-
329
-
330
-
331
-
332
-
333
-
334
-
335
-
336
-
337
-
338
-
339
-
340
-
341
-
342
-
343
-
344
-
345
-
346
-
347
-
348
-
349
-
350
-
351
-
352
-
353
-
354
-
355
-
356
-
357
-
358
-
359
-
360
-
361
-
362
-
363
-
364
-
365
-
366
-
367
-
368
-
369
-
370
-
371
-
372
-
373
-
374
-
375
-
376
-
377
-
378
-
379
-
380
-
381
-
382
-
383
-
384
-
385
-
386
 |
 |

Table of Contents
Comcast Corporation
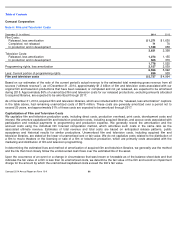
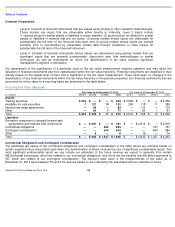
Our assessment of the significance of a particular input to the fair value measurement requires judgment and may affect the
valuation of financial instruments and their classification within the fair value hierarchy. Financial instruments are classified in their
entirety based on the lowest level of input that is significant to the fair value measurement. There have been no changes in the
classification of any financial instruments within the fair value hierarchy in the periods presented. Our financial instruments that are
accounted for at fair value on a recurring basis are presented in the table below.
Recurring Fair Value Measures
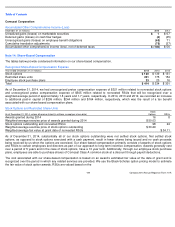
Contractual Obligations and Contingent Consideration
The estimated fair values of the contractual obligations and contingent consideration in the table above are primarily based on
certain expected future discounted cash flows, the determination of which involves the use of significant unobservable inputs. The
most significant unobservable inputs we use include our estimates of the future revenue we expect to generate from certain
NBCUniversal businesses, which are related to our contractual obligations, and future net tax benefits that will affect payments to
GE, which are related to our contingent consideration. The discount rates used in the measurements of fair value as of
December 31, 2014 were between 5% and 13% and are based on the underlying risk associated with our estimate of future
•
Level 2: Consists of financial instruments that are valued using models or other valuation methodologies.
These models use inputs that are observable either directly or indirectly. Level 2 inputs include
(1) quoted prices for similar assets or liabilities in active markets, (2) quoted prices for identical or similar
assets or liabilities in markets that are not active, (3) pricing models whose inputs are observable for
substantially the full term of the financial instrument and (4) pricing models whose inputs are derived
primarily from or corroborated by observable market data through correlation or other means for
substantially the full term of the financial instrument.
•
Level 3: Consists of financial instruments whose values are determined using pricing models that use
significant inputs that are primarily unobservable, discounted cash flow methodologies or similar
techniques, as well as instruments for which the determination of fair value requires significant
management judgment or estimation.
Fair Value as of December 31, 2014
Fair Value as of December 31, 2013
(in millions)
Level 1
Level 2
Level 3
Total
Level 1
Level 2
Level 3
Total
Assets
Trading securities
$
523
$
—
$
—
$
523
$
3,956
$
—
$
—
$
3,956
Available-for-sale securities
1
121
10
132
260
118
11
389
Interest rate swap agreements
—
84
—
84
—
110
—
110
Other
—
64
7
71
—
80
1
81
Total
$
524
$
269
$
17
$
810
$
4,216
$
308
$
12
$
4,536
Liabilities
Derivative component of prepaid forward sale
agreements and indexed debt instruments
$
—
$
361
$
—
$
361
$
—
$
2,816
$
—
$
2,816
Contractual obligations
—
—
883
883
—
—
747
747
Contingent consideration
—
—
644
644
—
—
684
684
Other
—
8
—
8
—
16
—
16
Total
$
—
$
369
$
1,527
$
1,896
$
—
$
2,832
$
1,431
$
4,263
Comcast 2014 Annual Report on Form 10-K
106