Comcast 2014 Annual Report Download - page 168
Download and view the complete annual report
Please find page 168 of the 2014 Comcast annual report below. You can navigate through the pages in the report by either clicking on the pages listed below, or by using the keyword search tool below to find specific information within the annual report.-
 1
1 -
2
-
3
-
4
-
5
-
6
-
7
-
8
-
9
-
10
-
11
-
12
-
13
-
14
-
15
-
16
-
17
-
18
-
19
-
20
-
21
-
22
-
23
-
24
-
25
-
26
-
27
-
28
-
29
-
30
-
31
-
32
-
33
-
34
-
35
-
36
-
37
-
38
-
39
-
40
-
41
-
42
-
43
-
44
-
45
-
46
-
47
-
48
-
49
-
50
-
51
-
52
-
53
-
54
-
55
-
56
-
57
-
58
-
59
-
60
-
61
-
62
-
63
-
64
-
65
-
66
-
67
-
68
-
69
-
70
-
71
-
72
-
73
-
74
-
75
-
76
-
77
-
78
-
79
-
80
-
81
-
82
-
83
-
84
-
85
-
86
-
87
-
88
-
89
-
90
-
91
-
92
-
93
-
94
-
95
-
96
-
97
-
98
-
99
-
100
-
101
-
102
-
103
-
104
-
105
-
106
-
107
-
108
-
109
-
110
-
111
-
112
-
113
-
114
-
115
-
116
-
117
-
118
-
119
-
120
-
121
-
122
-
123
-
124
-
125
-
126
-
127
-
128
-
129
-
130
-
131
-
132
-
133
-
134
-
135
-
136
-
137
-
138
-
139
-
140
-
141
-
142
-
143
-
144
-
145
-
146
-
147
-
148
-
149
-
150
-
151
-
152
-
153
-
154
-
155
-
156
-
157
-
 158
158 -
 159
159 -
 160
160 -
 161
161 -
 162
162 -
 163
163 -
 164
164 -
 165
165 -
 166
166 -
 167
167 -
 168
168 -
 169
169 -
 170
170 -
 171
171 -
 172
172 -
 173
173 -
 174
174 -
 175
175 -
 176
176 -
 177
177 -
 178
178 -
179
-
180
-
181
-
182
-
183
-
184
-
185
-
186
-
187
-
188
-
189
-
190
-
191
-
192
-
193
-
194
-
195
-
196
-
197
-
198
-
199
-
200
-
201
-
202
-
203
-
204
-
205
-
206
-
207
-
208
-
209
-
210
-
211
-
212
-
213
-
214
-
215
-
216
-
217
-
218
-
219
-
220
-
221
-
222
-
223
-
224
-
225
-
226
-
227
-
228
-
229
-
230
-
231
-
232
-
233
-
234
-
235
-
236
-
237
-
238
-
239
-
240
-
241
-
242
-
243
-
244
-
245
-
246
-
247
-
248
-
249
-
250
-
251
-
252
-
253
-
254
-
255
-
256
-
257
-
258
-
259
-
260
-
261
-
262
-
263
-
264
-
265
-
266
-
267
-
268
-
269
-
270
-
271
-
272
-
273
-
274
-
275
-
276
-
277
-
278
-
279
-
280
-
281
-
282
-
283
-
284
-
285
-
286
-
287
-
288
-
289
-
290
-
291
-
292
-
293
-
294
-
295
-
296
-
297
-
298
-
299
-
300
-
301
-
302
-
303
-
304
-
305
-
306
-
307
-
308
-
309
-
310
-
311
-
312
-
313
-
314
-
315
-
316
-
317
-
318
-
319
-
320
-
321
-
322
-
323
-
324
-
325
-
326
-
327
-
328
-
329
-
330
-
331
-
332
-
333
-
334
-
335
-
336
-
337
-
338
-
339
-
340
-
341
-
342
-
343
-
344
-
345
-
346
-
347
-
348
-
349
-
350
-
351
-
352
-
353
-
354
-
355
-
356
-
357
-
358
-
359
-
360
-
361
-
362
-
363
-
364
-
365
-
366
-
367
-
368
-
369
-
370
-
371
-
372
-
373
-
374
-
375
-
376
-
377
-
378
-
379
-
380
-
381
-
382
-
383
-
384
-
385
-
386
 |
 |

Table of Contents
NBCUniversal Media, LLC
ment to other income (expense), net. During 2013, we recorded $249 million of impairment charges to our equity method
investments, which primarily related to a regional sports cable network based in Houston, Texas.
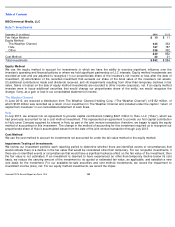
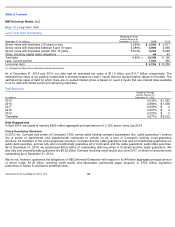
Note 8: Property and Equipment
Property and equipment are stated at cost. We capitalize improvements that extend asset lives and expense repairs and
maintenance costs as incurred. We record depreciation using the straight-line method over the asset’
s estimated useful life. For
assets that are sold or retired, we remove the applicable cost and accumulated depreciation and, unless the gain or loss on
disposition is presented separately, we recognize it as a component of depreciation expense.
We evaluate the recoverability of our property and equipment whenever events or substantive changes in circumstances indicate
that the carrying amount may not be recoverable. The evaluation is based on the cash flows generated by the underlying asset
groups, including estimated future operating results, trends or other determinants of fair value. If the total of the expected future
undiscounted cash flows were less than the carrying amount of the asset group, we would recognize an impairment charge to the
extent the carrying amount of the asset group exceeded its estimated fair value. Unless presented separately, the impairment
charge is included as a component of depreciation expense.
Acquisitions of Real Estate Properties
Real estate acquisitions in 2013 included our purchase from GE of certain properties we occupy at 30 Rockefeller Plaza in New
York City and CNBC’
s headquarters in Englewood Cliffs, New Jersey. The CNBC property was previously recorded as a capital
lease in our consolidated balance sheet. Other purchases in 2013 included our acquisition of a business whose primary asset is a
property located at 10 Universal City Plaza, which is adjacent to our Universal theme park in Hollywood, California. These
purchases resulted in increases in 2013 of $1.7 billion in property and equipment, which are included, as applicable, within the
captions “buildings and leasehold improvements” and “land” in the table above.
December 31 (in millions)
Weighted
-
Average
Original Useful Life
as of December 31, 2014
2014
2013
Buildings and leasehold improvements
21 years
$
5,780
$
5,239
Furniture, fixtures and equipment
7 years
2,930
2,383
Construction in process
N/A
775
828
Land
N/A
820
799
Property and equipment, at cost
10,305
9,249
Less: Accumulated depreciation
2,167
1,599
Property and equipment, net
$
8,138
$
7,650
163
Comcast 2014 Annual Report on Form 10
-
K