Comcast 2014 Annual Report Download - page 105
Download and view the complete annual report
Please find page 105 of the 2014 Comcast annual report below. You can navigate through the pages in the report by either clicking on the pages listed below, or by using the keyword search tool below to find specific information within the annual report.-
 1
1 -
2
-
3
-
4
-
5
-
6
-
7
-
8
-
9
-
10
-
11
-
12
-
13
-
14
-
15
-
16
-
17
-
18
-
19
-
20
-
21
-
22
-
23
-
24
-
25
-
26
-
27
-
28
-
29
-
30
-
31
-
32
-
33
-
34
-
35
-
36
-
37
-
38
-
39
-
40
-
41
-
42
-
43
-
44
-
45
-
46
-
47
-
48
-
49
-
50
-
51
-
52
-
53
-
54
-
55
-
56
-
57
-
58
-
59
-
60
-
61
-
62
-
63
-
64
-
65
-
66
-
67
-
68
-
69
-
70
-
71
-
72
-
73
-
74
-
75
-
76
-
77
-
78
-
79
-
80
-
81
-
82
-
83
-
84
-
85
-
86
-
87
-
88
-
89
-
90
-
91
-
92
-
93
-
94
-
 95
95 -
 96
96 -
 97
97 -
 98
98 -
 99
99 -
 100
100 -
 101
101 -
 102
102 -
 103
103 -
 104
104 -
 105
105 -
 106
106 -
 107
107 -
 108
108 -
 109
109 -
 110
110 -
 111
111 -
 112
112 -
 113
113 -
 114
114 -
 115
115 -
116
-
117
-
118
-
119
-
120
-
121
-
122
-
123
-
124
-
125
-
126
-
127
-
128
-
129
-
130
-
131
-
132
-
133
-
134
-
135
-
136
-
137
-
138
-
139
-
140
-
141
-
142
-
143
-
144
-
145
-
146
-
147
-
148
-
149
-
150
-
151
-
152
-
153
-
154
-
155
-
156
-
157
-
158
-
159
-
160
-
161
-
162
-
163
-
164
-
165
-
166
-
167
-
168
-
169
-
170
-
171
-
172
-
173
-
174
-
175
-
176
-
177
-
178
-
179
-
180
-
181
-
182
-
183
-
184
-
185
-
186
-
187
-
188
-
189
-
190
-
191
-
192
-
193
-
194
-
195
-
196
-
197
-
198
-
199
-
200
-
201
-
202
-
203
-
204
-
205
-
206
-
207
-
208
-
209
-
210
-
211
-
212
-
213
-
214
-
215
-
216
-
217
-
218
-
219
-
220
-
221
-
222
-
223
-
224
-
225
-
226
-
227
-
228
-
229
-
230
-
231
-
232
-
233
-
234
-
235
-
236
-
237
-
238
-
239
-
240
-
241
-
242
-
243
-
244
-
245
-
246
-
247
-
248
-
249
-
250
-
251
-
252
-
253
-
254
-
255
-
256
-
257
-
258
-
259
-
260
-
261
-
262
-
263
-
264
-
265
-
266
-
267
-
268
-
269
-
270
-
271
-
272
-
273
-
274
-
275
-
276
-
277
-
278
-
279
-
280
-
281
-
282
-
283
-
284
-
285
-
286
-
287
-
288
-
289
-
290
-
291
-
292
-
293
-
294
-
295
-
296
-
297
-
298
-
299
-
300
-
301
-
302
-
303
-
304
-
305
-
306
-
307
-
308
-
309
-
310
-
311
-
312
-
313
-
314
-
315
-
316
-
317
-
318
-
319
-
320
-
321
-
322
-
323
-
324
-
325
-
326
-
327
-
328
-
329
-
330
-
331
-
332
-
333
-
334
-
335
-
336
-
337
-
338
-
339
-
340
-
341
-
342
-
343
-
344
-
345
-
346
-
347
-
348
-
349
-
350
-
351
-
352
-
353
-
354
-
355
-
356
-
357
-
358
-
359
-
360
-
361
-
362
-
363
-
364
-
365
-
366
-
367
-
368
-
369
-
370
-
371
-
372
-
373
-
374
-
375
-
376
-
377
-
378
-
379
-
380
-
381
-
382
-
383
-
384
-
385
-
386
 |
 |

Table of Contents
Comcast Corporation
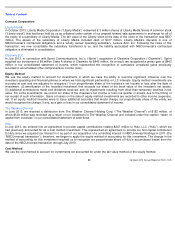
AirTouch Communications, Inc.
We hold two series of preferred stock of AirTouch Communications, Inc. (“AirTouch”),
a subsidiary of Verizon Communications Inc.,
which are redeemable in April 2020. As of both December 31, 2014 and 2013, the estimated fair value of the AirTouch preferred
stock was $1.7 billion.
The dividend and redemption activity of the AirTouch preferred stock determines the dividend and redemption payments associated
with substantially all of the preferred shares issued by one of our consolidated subsidiaries, which is a VIE. The subsidiary has
three series of preferred stock outstanding with an aggregate redemption value of $1.75 billion. Substantially all of the AirTouch
preferred stock is redeemable in April 2020 at a redemption value of $1.65 billion. As of December 31, 2014 and 2013, the two
redeemable series of subsidiary preferred shares were recorded at $1.6 billion and $1.5 billion, respectively, and those amounts are
included in other noncurrent liabilities. As of both December 31, 2014 and 2013, the redeemable subsidiary preferred shares had
an estimated fair value of $1.7 billion. The estimated fair values of the AirTouch preferred stock and redeemable subsidiary
preferred shares are based on Level 2 inputs that use pricing models whose inputs are derived primarily from or corroborated by
observable market data through correlation or other means for substantially the full term of the financial instrument. The one
nonredeemable series of subsidiary preferred shares was recorded at $100 million as of both December 31, 2014 and 2013, and
those amounts are included in noncontrolling interests in our consolidated balance sheet. The carrying amount of the
nonredeemable subsidiary preferred stock approximates its fair value.
Impairment Testing of Investments
We review our investment portfolio each reporting period to determine whether there are identified events or circumstances that
would indicate there is a decline in the fair value that would be considered other than temporary. For our nonpublic investments, if
there are no identified events or circumstances that would have a significant adverse effect on the fair value of the investment, then
the fair value is not estimated. If an investment is deemed to have experienced an other-than-
temporary decline below its cost
basis, we reduce the carrying amount of the investment to its quoted or estimated fair value, as applicable, and establish a new
cost basis for the investment. For our AFS and cost method investments, we record the impairment to investment income (loss),
net. For our equity method investments, we record the impairment to other income (expense), net. During 2013, we recorded $249
million of impairment charges to our equity method investments, which primarily related to a regional sports cable network based in
Houston, Texas.
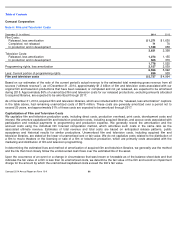
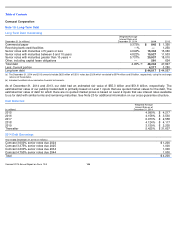
Note 8: Property and Equipment
Property and equipment are stated at cost. We capitalize improvements that extend asset lives and expense repairs and
maintenance costs as incurred. We record depreciation using the straight-line method over the
December 31 (in millions)
Weighted-
Average
Original Useful Life
As of December 31, 2014
2014
2013
Cable distribution system
11 years
$
31,655
$
30,498
Customer premise equipment
6 years
27,086
25,949
Other equipment
6 years
7,860
6,826
Buildings and leasehold improvements
22 years
8,650
8,057
Land
N/A
1,112
1,084
Property and equipment, at cost
76,363
72,414
Less: Accumulated depreciation
45,410
42,574
Property and equipment, net
$
30,953
$
29,840
Comcast 2014 Annual Report on Form 10
-
K
100