Comcast 2014 Annual Report Download - page 67
Download and view the complete annual report
Please find page 67 of the 2014 Comcast annual report below. You can navigate through the pages in the report by either clicking on the pages listed below, or by using the keyword search tool below to find specific information within the annual report.-
 1
1 -
2
-
3
-
4
-
5
-
6
-
7
-
8
-
9
-
10
-
11
-
12
-
13
-
14
-
15
-
16
-
17
-
18
-
19
-
20
-
21
-
22
-
23
-
24
-
25
-
26
-
27
-
28
-
29
-
30
-
31
-
32
-
33
-
34
-
35
-
36
-
37
-
38
-
39
-
40
-
41
-
42
-
43
-
44
-
45
-
46
-
47
-
48
-
49
-
50
-
51
-
52
-
53
-
54
-
55
-
56
-
 57
57 -
 58
58 -
 59
59 -
 60
60 -
 61
61 -
 62
62 -
 63
63 -
 64
64 -
 65
65 -
 66
66 -
 67
67 -
 68
68 -
 69
69 -
 70
70 -
 71
71 -
 72
72 -
 73
73 -
 74
74 -
 75
75 -
 76
76 -
 77
77 -
78
-
79
-
80
-
81
-
82
-
83
-
84
-
85
-
86
-
87
-
88
-
89
-
90
-
91
-
92
-
93
-
94
-
95
-
96
-
97
-
98
-
99
-
100
-
101
-
102
-
103
-
104
-
105
-
106
-
107
-
108
-
109
-
110
-
111
-
112
-
113
-
114
-
115
-
116
-
117
-
118
-
119
-
120
-
121
-
122
-
123
-
124
-
125
-
126
-
127
-
128
-
129
-
130
-
131
-
132
-
133
-
134
-
135
-
136
-
137
-
138
-
139
-
140
-
141
-
142
-
143
-
144
-
145
-
146
-
147
-
148
-
149
-
150
-
151
-
152
-
153
-
154
-
155
-
156
-
157
-
158
-
159
-
160
-
161
-
162
-
163
-
164
-
165
-
166
-
167
-
168
-
169
-
170
-
171
-
172
-
173
-
174
-
175
-
176
-
177
-
178
-
179
-
180
-
181
-
182
-
183
-
184
-
185
-
186
-
187
-
188
-
189
-
190
-
191
-
192
-
193
-
194
-
195
-
196
-
197
-
198
-
199
-
200
-
201
-
202
-
203
-
204
-
205
-
206
-
207
-
208
-
209
-
210
-
211
-
212
-
213
-
214
-
215
-
216
-
217
-
218
-
219
-
220
-
221
-
222
-
223
-
224
-
225
-
226
-
227
-
228
-
229
-
230
-
231
-
232
-
233
-
234
-
235
-
236
-
237
-
238
-
239
-
240
-
241
-
242
-
243
-
244
-
245
-
246
-
247
-
248
-
249
-
250
-
251
-
252
-
253
-
254
-
255
-
256
-
257
-
258
-
259
-
260
-
261
-
262
-
263
-
264
-
265
-
266
-
267
-
268
-
269
-
270
-
271
-
272
-
273
-
274
-
275
-
276
-
277
-
278
-
279
-
280
-
281
-
282
-
283
-
284
-
285
-
286
-
287
-
288
-
289
-
290
-
291
-
292
-
293
-
294
-
295
-
296
-
297
-
298
-
299
-
300
-
301
-
302
-
303
-
304
-
305
-
306
-
307
-
308
-
309
-
310
-
311
-
312
-
313
-
314
-
315
-
316
-
317
-
318
-
319
-
320
-
321
-
322
-
323
-
324
-
325
-
326
-
327
-
328
-
329
-
330
-
331
-
332
-
333
-
334
-
335
-
336
-
337
-
338
-
339
-
340
-
341
-
342
-
343
-
344
-
345
-
346
-
347
-
348
-
349
-
350
-
351
-
352
-
353
-
354
-
355
-
356
-
357
-
358
-
359
-
360
-
361
-
362
-
363
-
364
-
365
-
366
-
367
-
368
-
369
-
370
-
371
-
372
-
373
-
374
-
375
-
376
-
377
-
378
-
379
-
380
-
381
-
382
-
383
-
384
-
385
-
386
 |
 |

Table of Contents
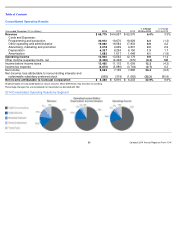
Cable Networks Segment Results of Operations
Cable Networks Segment – Revenue
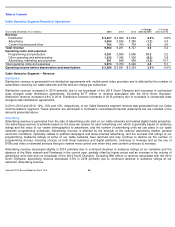
Distribution
Distribution revenue is generated from distribution agreements with multichannel video providers and is affected by the number of
subscribers receiving our cable networks and the fees we charge per subscriber.
Distribution revenue increased in 2014 primarily due to our broadcast of the 2014 Sochi Olympics and increases in contractual
rates charged under distribution agreements. Excluding $177 million of revenue associated with the 2014 Sochi Olympics,
distribution revenue increased 4.6% in 2014. Distribution revenue increased in 2013 primarily due to increases in contractual rates
charged under distribution agreements.
In 2014, 2013 and 2012, 12%, 13% and 13%, respectively, of our Cable Networks segment revenue was generated from our Cable
Communications segment. These amounts are eliminated in Comcast’
s consolidated financial statements but are included in the
amounts presented above.
Advertising
Advertising revenue is generated from the sale of advertising units sold on our cable networks and related digital media properties.
Our advertising revenue is primarily based on the price we receive for each advertising unit, which is generally based on audience
ratings and the value of our viewer demographics to advertisers, and the number of advertising units we can place in our cable
networks’
programming schedules. Advertising revenue is affected by the strength of the national advertising market, general
economic conditions, cyclicality related to political campaigns and issue-
oriented advertising, and the success and ratings of our
programming. Audience ratings at some of our cable networks have declined and may continue to decline as the number of
programming choices, including choices on both linear television and digital platforms, continues to increase and as the use of
DVRs and video on demand services that give viewers more control over when they view content continues to increase.
Advertising revenue decreased slightly in 2014 primarily due to continued declines in audience ratings at our networks and the
absence of the Style network and Fandango in the current year, partially offset by higher prices and an increase in the volume of
advertising units sold and our broadcast of the 2014 Sochi Olympics. Excluding $80 million of revenue associated with the 2014
Sochi Olympics, advertising revenue decreased 3.5% in 2014 primarily due to continued declines in audience ratings at our
networks. Advertising revenue
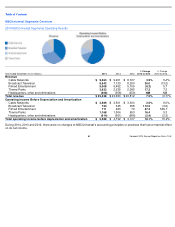
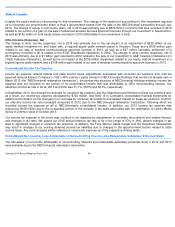
Year ended December 31 (in millions)
2014
2013
2012
% Change
2013 to 2014
% Change
2012 to 2013
Revenue
Distribution
$
5,307
$
4,905
$
4,604
8.2
%
6.5
%
Advertising
3,494
3,536
3,389
(1.2
)
4.3
Content licensing and other
762
760
734
0.3
3.6
Total revenue
9,563
9,201
8,727
3.9
5.4
Operating costs and expenses
Programming and production
4,241
3,850
3,659
10.2
5.2
Other operating and administrative
1,232
1,342
1,306
(8.3
)
2.8
Advertising, marketing and promotion
501
508
459
(1.3
)
10.7
Total operating costs and expenses
5,974
5,700
5,424
4.8
5.1
Operating income before depreciation and amortization
$
3,589
$
3,501
$
3,303
2.5
%
6.0
%
Comcast 2014 Annual Report on Form 10
-
K
62