Comcast 2014 Annual Report Download - page 78
Download and view the complete annual report
Please find page 78 of the 2014 Comcast annual report below. You can navigate through the pages in the report by either clicking on the pages listed below, or by using the keyword search tool below to find specific information within the annual report.-
 1
1 -
2
-
3
-
4
-
5
-
6
-
7
-
8
-
9
-
10
-
11
-
12
-
13
-
14
-
15
-
16
-
17
-
18
-
19
-
20
-
21
-
22
-
23
-
24
-
25
-
26
-
27
-
28
-
29
-
30
-
31
-
32
-
33
-
34
-
35
-
36
-
37
-
38
-
39
-
40
-
41
-
42
-
43
-
44
-
45
-
46
-
47
-
48
-
49
-
50
-
51
-
52
-
53
-
54
-
55
-
56
-
57
-
58
-
59
-
60
-
61
-
62
-
63
-
64
-
65
-
66
-
67
-
 68
68 -
 69
69 -
 70
70 -
 71
71 -
 72
72 -
 73
73 -
 74
74 -
 75
75 -
 76
76 -
 77
77 -
 78
78 -
 79
79 -
 80
80 -
 81
81 -
 82
82 -
 83
83 -
 84
84 -
 85
85 -
 86
86 -
 87
87 -
 88
88 -
89
-
90
-
91
-
92
-
93
-
94
-
95
-
96
-
97
-
98
-
99
-
100
-
101
-
102
-
103
-
104
-
105
-
106
-
107
-
108
-
109
-
110
-
111
-
112
-
113
-
114
-
115
-
116
-
117
-
118
-
119
-
120
-
121
-
122
-
123
-
124
-
125
-
126
-
127
-
128
-
129
-
130
-
131
-
132
-
133
-
134
-
135
-
136
-
137
-
138
-
139
-
140
-
141
-
142
-
143
-
144
-
145
-
146
-
147
-
148
-
149
-
150
-
151
-
152
-
153
-
154
-
155
-
156
-
157
-
158
-
159
-
160
-
161
-
162
-
163
-
164
-
165
-
166
-
167
-
168
-
169
-
170
-
171
-
172
-
173
-
174
-
175
-
176
-
177
-
178
-
179
-
180
-
181
-
182
-
183
-
184
-
185
-
186
-
187
-
188
-
189
-
190
-
191
-
192
-
193
-
194
-
195
-
196
-
197
-
198
-
199
-
200
-
201
-
202
-
203
-
204
-
205
-
206
-
207
-
208
-
209
-
210
-
211
-
212
-
213
-
214
-
215
-
216
-
217
-
218
-
219
-
220
-
221
-
222
-
223
-
224
-
225
-
226
-
227
-
228
-
229
-
230
-
231
-
232
-
233
-
234
-
235
-
236
-
237
-
238
-
239
-
240
-
241
-
242
-
243
-
244
-
245
-
246
-
247
-
248
-
249
-
250
-
251
-
252
-
253
-
254
-
255
-
256
-
257
-
258
-
259
-
260
-
261
-
262
-
263
-
264
-
265
-
266
-
267
-
268
-
269
-
270
-
271
-
272
-
273
-
274
-
275
-
276
-
277
-
278
-
279
-
280
-
281
-
282
-
283
-
284
-
285
-
286
-
287
-
288
-
289
-
290
-
291
-
292
-
293
-
294
-
295
-
296
-
297
-
298
-
299
-
300
-
301
-
302
-
303
-
304
-
305
-
306
-
307
-
308
-
309
-
310
-
311
-
312
-
313
-
314
-
315
-
316
-
317
-
318
-
319
-
320
-
321
-
322
-
323
-
324
-
325
-
326
-
327
-
328
-
329
-
330
-
331
-
332
-
333
-
334
-
335
-
336
-
337
-
338
-
339
-
340
-
341
-
342
-
343
-
344
-
345
-
346
-
347
-
348
-
349
-
350
-
351
-
352
-
353
-
354
-
355
-
356
-
357
-
358
-
359
-
360
-
361
-
362
-
363
-
364
-
365
-
366
-
367
-
368
-
369
-
370
-
371
-
372
-
373
-
374
-
375
-
376
-
377
-
378
-
379
-
380
-
381
-
382
-
383
-
384
-
385
-
386
 |
 |

Table of Contents
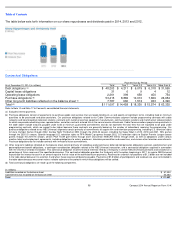
Capital Expenditures
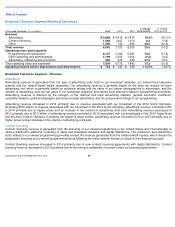
Our most significant recurring investing activity has been capital expenditures in our Cable Communications segment, and we
expect that this will continue in the future. The table below summarizes the capital expenditures we incurred in our Cable
Communications segment in 2014, 2013 and 2012.
Cable Communications capital expenditures increased in 2014 and 2013 primarily due to an increase in customer premise
equipment purchases, including purchases related to our X1 platform and Cloud DVR technology, as well as purchases related to
our wireless gateways in 2013, and increased investment in business services and network infrastructure to increase network
capacity.
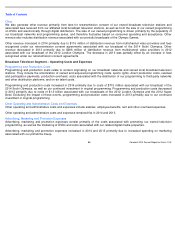
Capital expenditures in our NBCUniversal segments increased 5.3% to $1.2 billion in 2014 and 52.0% to $1.2 billion in 2013
primarily due to continued investment in our Universal theme parks.
Our capital expenditures for 2015 are expected to increase as we continue to invest in the deployment of our X1 platform and
Cloud DVR technology, and the expansion of business services and our home security and automation services. We also expect
capital expenditures to increase in 2015 as a result of integration efforts following the close of the Time Warner Cable merger.
Capital expenditures for subsequent years will depend on numerous factors, including acquisitions, competition, changes in
technology, regulatory changes, the timing and rate of deployment of new services, and the capacity required for existing services.
In addition, we expect to continue to invest in existing and new attractions at our Universal theme parks.
Cash Paid for Intangible Assets
In 2014, 2013 and 2012, cash paid for intangible assets consisted primarily of expenditures for software.
Acquisitions and Construction of Real Estate Properties
Acquisitions and construction of real estate properties in 2014 was not significant. In 2013, acquisitions and construction of real
estate properties included NBCUniversal’
s purchases of the 30 Rockefeller Plaza properties it occupies and the property located at
10 Universal City Plaza, which is adjacent to Universal Studios Hollywood in University City, California, and our purchase of an 80%
interest in a business whose primary asset is our corporate headquarters located in Philadelphia, Pennsylvania.
Proceeds from Sales of Businesses and Investments
In 2014, proceeds from sales of businesses and investments were primarily related to the sale of our investment in Arris Group and
the sale of equity securities following the settlement of certain of our prepaid forward sale agreements. In 2013, proceeds from
sales of businesses and investments were primarily related to the redemption of our Liberty Media Series A common stock by
Liberty Media Corporation and the sale of our investment in Clearwire. In 2012, proceeds from sales of businesses and investments
were primarily related to the sale of our investment in A&E Television Networks. Following the sale of our investment in A&E
Television Networks, NBCUniversal no longer receives dividends from A&E Television Networks. In 2012, NBCUniversal received
$129 million in dividends from A&E Television Networks, which were included in net cash provided by operating activities.
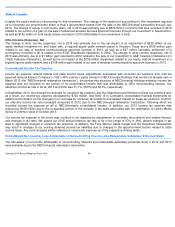
Year ended December 31 (in millions)
2014
2013
2012
Cable distribution system
$
2,047
$
1,819
$
1,720
Customer premise equipment
3,397
2,990
2,678
Other equipment
613
527
462
Buildings and building improvements
97
67
57
Land
—
—
4
Total
$
6,154
$
5,403
$
4,921
73
Comcast 2014 Annual Report on Form 10
-
K