Comcast 2014 Annual Report Download - page 109
Download and view the complete annual report
Please find page 109 of the 2014 Comcast annual report below. You can navigate through the pages in the report by either clicking on the pages listed below, or by using the keyword search tool below to find specific information within the annual report.-
 1
1 -
2
-
3
-
4
-
5
-
6
-
7
-
8
-
9
-
10
-
11
-
12
-
13
-
14
-
15
-
16
-
17
-
18
-
19
-
20
-
21
-
22
-
23
-
24
-
25
-
26
-
27
-
28
-
29
-
30
-
31
-
32
-
33
-
34
-
35
-
36
-
37
-
38
-
39
-
40
-
41
-
42
-
43
-
44
-
45
-
46
-
47
-
48
-
49
-
50
-
51
-
52
-
53
-
54
-
55
-
56
-
57
-
58
-
59
-
60
-
61
-
62
-
63
-
64
-
65
-
66
-
67
-
68
-
69
-
70
-
71
-
72
-
73
-
74
-
75
-
76
-
77
-
78
-
79
-
80
-
81
-
82
-
83
-
84
-
85
-
86
-
87
-
88
-
89
-
90
-
91
-
92
-
93
-
94
-
95
-
96
-
97
-
98
-
 99
99 -
 100
100 -
 101
101 -
 102
102 -
 103
103 -
 104
104 -
 105
105 -
 106
106 -
 107
107 -
 108
108 -
 109
109 -
 110
110 -
 111
111 -
 112
112 -
 113
113 -
 114
114 -
 115
115 -
 116
116 -
 117
117 -
 118
118 -
 119
119 -
120
-
121
-
122
-
123
-
124
-
125
-
126
-
127
-
128
-
129
-
130
-
131
-
132
-
133
-
134
-
135
-
136
-
137
-
138
-
139
-
140
-
141
-
142
-
143
-
144
-
145
-
146
-
147
-
148
-
149
-
150
-
151
-
152
-
153
-
154
-
155
-
156
-
157
-
158
-
159
-
160
-
161
-
162
-
163
-
164
-
165
-
166
-
167
-
168
-
169
-
170
-
171
-
172
-
173
-
174
-
175
-
176
-
177
-
178
-
179
-
180
-
181
-
182
-
183
-
184
-
185
-
186
-
187
-
188
-
189
-
190
-
191
-
192
-
193
-
194
-
195
-
196
-
197
-
198
-
199
-
200
-
201
-
202
-
203
-
204
-
205
-
206
-
207
-
208
-
209
-
210
-
211
-
212
-
213
-
214
-
215
-
216
-
217
-
218
-
219
-
220
-
221
-
222
-
223
-
224
-
225
-
226
-
227
-
228
-
229
-
230
-
231
-
232
-
233
-
234
-
235
-
236
-
237
-
238
-
239
-
240
-
241
-
242
-
243
-
244
-
245
-
246
-
247
-
248
-
249
-
250
-
251
-
252
-
253
-
254
-
255
-
256
-
257
-
258
-
259
-
260
-
261
-
262
-
263
-
264
-
265
-
266
-
267
-
268
-
269
-
270
-
271
-
272
-
273
-
274
-
275
-
276
-
277
-
278
-
279
-
280
-
281
-
282
-
283
-
284
-
285
-
286
-
287
-
288
-
289
-
290
-
291
-
292
-
293
-
294
-
295
-
296
-
297
-
298
-
299
-
300
-
301
-
302
-
303
-
304
-
305
-
306
-
307
-
308
-
309
-
310
-
311
-
312
-
313
-
314
-
315
-
316
-
317
-
318
-
319
-
320
-
321
-
322
-
323
-
324
-
325
-
326
-
327
-
328
-
329
-
330
-
331
-
332
-
333
-
334
-
335
-
336
-
337
-
338
-
339
-
340
-
341
-
342
-
343
-
344
-
345
-
346
-
347
-
348
-
349
-
350
-
351
-
352
-
353
-
354
-
355
-
356
-
357
-
358
-
359
-
360
-
361
-
362
-
363
-
364
-
365
-
366
-
367
-
368
-
369
-
370
-
371
-
372
-
373
-
374
-
375
-
376
-
377
-
378
-
379
-
380
-
381
-
382
-
383
-
384
-
385
-
386
 |
 |

Table of Contents
Comcast Corporation
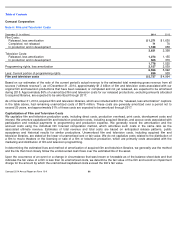
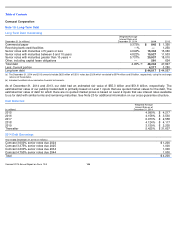
Note 10: Long-Term Debt
Long-Term Debt Outstanding
As of December 31, 2014 and 2013, our debt had an estimated fair value of $55.3 billion and $51.8 billion, respectively. The
estimated fair value of our publicly traded debt is primarily based on Level 1 inputs that use quoted market values for the debt. The
estimated fair value of debt for which there are no quoted market prices is based on Level 2 inputs that use interest rates available
to us for debt with similar terms and remaining maturities. See Note 20 for additional information on our cross-guarantee structure.
Debt Maturities
2014 Debt Borrowings
December 31 (in millions)
Weighted-
Average
Interest Rate as of
December 31, 2014
2014
2013
Commercial paper
0.373
%
$
845
$
1,350
Revolving bank credit facilities
—%
—
1,250
Senior notes with maturities of 5 years or less
4.642
%
15,334
15,080
Senior notes with maturities between 5 and 10 years
4.822
%
10,527
11,533
Senior notes with maturities greater than 10 years
5.737
%
20,937
18,010
Other, including capital lease obligations
—
591
624
Total debt
4.95
%
48,234
47,847
Less: Current portion
4,217
3,280
Long-term debt
$
44,017
$
44,567
(a)
The December 31, 2014 and 2013 amounts include £
625 million of 5.50% notes due 2029 which translated to $974 million and $1 billion, respectively, using the exchange
rates as of these dates.
(b)
Includes the effects of our derivative financial instruments.
(in millions)
Weighted-
Average
Interest Rate as of
December 31, 2014
2015
4.990
%
$
4,217
2016
4.158
%
$
3,530
2017
6.973
%
$
2,558
2018
4.124
%
$
4,117
2019
3.159
%
$
2,205
Thereafter
5.425
%
$
31,607
Year ended December 31, 2014 (in millions)
Comcast 3.600% senior notes due 2024
$
1,200
Comcast 3.375% senior notes due 2025
1,000
Comcast 4.200% senior notes due 2034
1,000
Comcast 4.750% senior notes due 2044
1,000
Total
$
4,200
Comcast 2014 Annual Report on Form 10
-
K
104
(a)
(b)