Comcast 2014 Annual Report Download - page 128
Download and view the complete annual report
Please find page 128 of the 2014 Comcast annual report below. You can navigate through the pages in the report by either clicking on the pages listed below, or by using the keyword search tool below to find specific information within the annual report.-
 1
1 -
 2
2 -
 3
3 -
 4
4 -
 5
5 -
 6
6 -
 7
7 -
 8
8 -
 9
9 -
 10
10 -
 11
11 -
 12
12 -
 13
13 -
 14
14 -
 15
15 -
 16
16 -
 17
17 -
 18
18 -
 19
19 -
 20
20 -
 21
21 -
 22
22 -
 23
23 -
 24
24 -
 25
25 -
 26
26 -
 27
27 -
 28
28 -
 29
29 -
 30
30 -
 31
31 -
 32
32 -
 33
33 -
 34
34 -
 35
35 -
 36
36 -
 37
37 -
 38
38 -
 39
39 -
 40
40 -
 41
41 -
 42
42 -
 43
43 -
 44
44 -
 45
45 -
 46
46 -
 47
47 -
 48
48 -
 49
49 -
 50
50 -
 51
51 -
 52
52 -
 53
53 -
 54
54 -
 55
55 -
 56
56 -
 57
57 -
 58
58 -
 59
59 -
 60
60 -
 61
61 -
 62
62 -
 63
63 -
 64
64 -
 65
65 -
 66
66 -
 67
67 -
 68
68 -
 69
69 -
 70
70 -
 71
71 -
 72
72 -
 73
73 -
 74
74 -
 75
75 -
 76
76 -
 77
77 -
 78
78 -
 79
79 -
 80
80 -
 81
81 -
 82
82 -
 83
83 -
 84
84 -
 85
85 -
 86
86 -
 87
87 -
 88
88 -
 89
89 -
 90
90 -
 91
91 -
 92
92 -
 93
93 -
 94
94 -
 95
95 -
 96
96 -
 97
97 -
 98
98 -
 99
99 -
 100
100 -
 101
101 -
 102
102 -
 103
103 -
 104
104 -
 105
105 -
 106
106 -
 107
107 -
 108
108 -
 109
109 -
 110
110 -
 111
111 -
 112
112 -
 113
113 -
 114
114 -
 115
115 -
 116
116 -
 117
117 -
 118
118 -
 119
119 -
 120
120 -
 121
121 -
 122
122 -
 123
123 -
 124
124 -
 125
125 -
 126
126 -
 127
127 -
 128
128 -
 129
129 -
 130
130 -
 131
131 -
 132
132 -
 133
133 -
 134
134 -
 135
135 -
 136
136 -
 137
137 -
 138
138 -
 139
139 -
 140
140 -
 141
141 -
 142
142 -
 143
143 -
 144
144 -
 145
145 -
 146
146 -
 147
147 -
 148
148 -
 149
149 -
 150
150 -
 151
151 -
 152
152 -
 153
153 -
 154
154 -
 155
155 -
 156
156 -
 157
157 -
 158
158 -
 159
159 -
 160
160 -
 161
161 -
 162
162 -
 163
163 -
 164
164 -
 165
165 -
 166
166 -
 167
167 -
 168
168 -
 169
169 -
 170
170 -
 171
171 -
 172
172 -
 173
173 -
 174
174 -
 175
175 -
 176
176 -
 177
177 -
 178
178 -
 179
179 -
 180
180 -
 181
181 -
 182
182 -
 183
183 -
 184
184 -
 185
185 -
 186
186 -
 187
187 -
 188
188 -
 189
189 -
 190
190 -
 191
191 -
 192
192 -
 193
193 -
 194
194 -
 195
195 -
 196
196 -
 197
197 -
 198
198 -
 199
199 -
 200
200 -
 201
201 -
 202
202 -
 203
203 -
 204
204 -
 205
205 -
 206
206 -
 207
207 -
 208
208 -
 209
209 -
 210
210 -
 211
211 -
 212
212 -
 213
213 -
 214
214 -
 215
215 -
 216
216 -
 217
217 -
 218
218 -
 219
219 -
 220
220 -
 221
221 -
 222
222 -
 223
223 -
 224
224 -
 225
225 -
 226
226 -
 227
227 -
 228
228 -
 229
229 -
 230
230 -
 231
231 -
 232
232 -
 233
233 -
 234
234 -
 235
235 -
 236
236 -
 237
237 -
 238
238 -
 239
239 -
 240
240 -
 241
241 -
 242
242 -
 243
243 -
 244
244 -
 245
245 -
 246
246 -
 247
247 -
 248
248 -
 249
249 -
 250
250 -
 251
251 -
 252
252 -
 253
253 -
 254
254 -
 255
255 -
 256
256 -
 257
257 -
 258
258 -
 259
259 -
 260
260 -
 261
261 -
 262
262 -
 263
263 -
 264
264 -
 265
265 -
 266
266 -
 267
267 -
 268
268 -
 269
269 -
 270
270 -
 271
271 -
 272
272 -
 273
273 -
 274
274 -
 275
275 -
 276
276 -
 277
277 -
 278
278 -
 279
279 -
 280
280 -
 281
281 -
 282
282 -
 283
283 -
 284
284 -
 285
285 -
 286
286 -
 287
287 -
 288
288 -
 289
289 -
 290
290 -
 291
291 -
 292
292 -
 293
293 -
 294
294 -
 295
295 -
 296
296 -
 297
297 -
 298
298 -
 299
299 -
 300
300 -
 301
301 -
 302
302 -
 303
303 -
 304
304 -
 305
305 -
 306
306 -
 307
307 -
 308
308 -
 309
309 -
 310
310 -
 311
311 -
 312
312 -
 313
313 -
 314
314 -
 315
315 -
 316
316 -
 317
317 -
 318
318 -
 319
319 -
 320
320 -
 321
321 -
 322
322 -
 323
323 -
 324
324 -
 325
325 -
 326
326 -
 327
327 -
 328
328 -
 329
329 -
 330
330 -
 331
331 -
 332
332 -
 333
333 -
 334
334 -
 335
335 -
 336
336 -
 337
337 -
 338
338 -
 339
339 -
 340
340 -
 341
341 -
 342
342 -
 343
343 -
 344
344 -
 345
345 -
 346
346 -
 347
347 -
 348
348 -
 349
349 -
 350
350 -
 351
351 -
 352
352 -
 353
353 -
 354
354 -
 355
355 -
 356
356 -
 357
357 -
 358
358 -
 359
359 -
 360
360 -
 361
361 -
 362
362 -
 363
363 -
 364
364 -
 365
365 -
 366
366 -
 367
367 -
 368
368 -
 369
369 -
 370
370 -
 371
371 -
 372
372 -
 373
373 -
 374
374 -
 375
375 -
 376
376 -
 377
377 -
 378
378 -
 379
379 -
 380
380 -
 381
381 -
 382
382 -
 383
383 -
 384
384 -
 385
385 -
 386
386
 |
 |

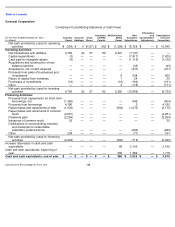
Table of Contents
Comcast Corporation
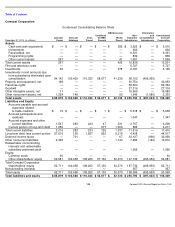
Condensed Consolidating Balance Sheet
December 31, 2014 (in millions)
Comcast
Parent
Comcast
Holdings
CCCL
Parent
Combined
CCHMO
Parents
NBCUniversal
Media
Parent
Non
-
Guarantor
Subsidiaries
Elimination
and
Consolidation
Adjustments
Consolidated
Comcast
Corporation
Assets
Cash and cash equivalents
$
—
$
—
$
—
$
—
$
385
$
3,525
$
—
$
3,910
Investments
—
—
—
—
—
602
—
602
Receivables, net
—
—
—
—
—
6,321
—
6,321
Programming rights
—
—
—
—
—
839
—
839
Other current assets
267
—
—
—
41
1,551
—
1,859
Total current assets
267
—
—
—
426
12,838
—
13,531
Film and television costs
—
—
—
—
—
5,727
—
5,727
Investments
36
—
—
—
378
2,721
—
3,135
Investments in and amounts due
from subsidiaries eliminated upon
consolidation
84,142
103,420
110,323
58,677
41,239
98,152
(495,953
)
—
Property and equipment, net
199
—
—
—
—
30,754
—
30,953
Franchise rights
—
—
—
—
—
59,364
—
59,364
Goodwill
—
—
—
—
—
27,316
—
27,316
Other intangible assets, net
11
—
—
—
—
16,969
—
16,980
Other noncurrent assets, net
1,224
148
—
—
92
1,949
(1,080
)
2,333
Total assets
$
85,879
$
103,568
$
110,323
$
58,677
$
42,135
$
255,790
$
(497,033
)
$
159,339
Liabilities and Equity
Accounts payable and accrued
expenses related
to trade creditors
$
19
$
—
$
—
$
1
$
—
$
5,618
$
—
$
5,638
Accrued participations and
residuals
—
—
—
—
—
1,347
—
1,347
Accrued expenses and other
current liabilities
1,547
283
233
47
331
3,767
—
6,208
Current portion of long
-
term debt
1,650
—
—
677
1,006
884
—
4,217
Total current liabilities
3,216
283
233
725
1,337
11,616
—
17,410
Long-term debt, less current portion
27,616
126
1,827
822
9,218
4,408
—
44,017
Deferred income taxes
—
701
—
—
67
33,127
(936
)
32,959
Other noncurrent liabilities
2,336
—
—
—
1,143
7,484
(144
)
10,819
Redeemable noncontrolling
interests and redeemable
subsidiary preferred stock
—
—
—
—
—
1,066
—
1,066
Equity:
Common stock
30
—
—
—
—
—
—
30
Other shareholders’ equity
52,681
102,458
108,263
57,130
30,370
197,732
(495,953
)
52,681
Total Comcast Corporation
shareholders
’
equity
52,711
102,458
108,263
57,130
30,370
197,732
(495,953
)
52,711
Noncontrolling interests
—
—
—
—
—
357
—
357
Total equity
52,711
102,458
108,263
57,130
30,370
198,089
(495,953
)
53,068
Total liabilities and equity
$
85,879
$
103,568
$
110,323
$
58,677
$
42,135
$
255,790
$
(497,033
)
$
159,339
123
Comcast 2014 Annual Report on Form 10
-
K
