Comcast 2014 Annual Report Download - page 125
Download and view the complete annual report
Please find page 125 of the 2014 Comcast annual report below. You can navigate through the pages in the report by either clicking on the pages listed below, or by using the keyword search tool below to find specific information within the annual report.-
 1
1 -
2
-
3
-
4
-
5
-
6
-
7
-
8
-
9
-
10
-
11
-
12
-
13
-
14
-
15
-
16
-
17
-
18
-
19
-
20
-
21
-
22
-
23
-
24
-
25
-
26
-
27
-
28
-
29
-
30
-
31
-
32
-
33
-
34
-
35
-
36
-
37
-
38
-
39
-
40
-
41
-
42
-
43
-
44
-
45
-
46
-
47
-
48
-
49
-
50
-
51
-
52
-
53
-
54
-
55
-
56
-
57
-
58
-
59
-
60
-
61
-
62
-
63
-
64
-
65
-
66
-
67
-
68
-
69
-
70
-
71
-
72
-
73
-
74
-
75
-
76
-
77
-
78
-
79
-
80
-
81
-
82
-
83
-
84
-
85
-
86
-
87
-
88
-
89
-
90
-
91
-
92
-
93
-
94
-
95
-
96
-
97
-
98
-
99
-
100
-
101
-
102
-
103
-
104
-
105
-
106
-
107
-
108
-
109
-
110
-
111
-
112
-
113
-
114
-
 115
115 -
 116
116 -
 117
117 -
 118
118 -
 119
119 -
 120
120 -
 121
121 -
 122
122 -
 123
123 -
 124
124 -
 125
125 -
 126
126 -
 127
127 -
 128
128 -
 129
129 -
 130
130 -
 131
131 -
 132
132 -
 133
133 -
 134
134 -
 135
135 -
136
-
137
-
138
-
139
-
140
-
141
-
142
-
143
-
144
-
145
-
146
-
147
-
148
-
149
-
150
-
151
-
152
-
153
-
154
-
155
-
156
-
157
-
158
-
159
-
160
-
161
-
162
-
163
-
164
-
165
-
166
-
167
-
168
-
169
-
170
-
171
-
172
-
173
-
174
-
175
-
176
-
177
-
178
-
179
-
180
-
181
-
182
-
183
-
184
-
185
-
186
-
187
-
188
-
189
-
190
-
191
-
192
-
193
-
194
-
195
-
196
-
197
-
198
-
199
-
200
-
201
-
202
-
203
-
204
-
205
-
206
-
207
-
208
-
209
-
210
-
211
-
212
-
213
-
214
-
215
-
216
-
217
-
218
-
219
-
220
-
221
-
222
-
223
-
224
-
225
-
226
-
227
-
228
-
229
-
230
-
231
-
232
-
233
-
234
-
235
-
236
-
237
-
238
-
239
-
240
-
241
-
242
-
243
-
244
-
245
-
246
-
247
-
248
-
249
-
250
-
251
-
252
-
253
-
254
-
255
-
256
-
257
-
258
-
259
-
260
-
261
-
262
-
263
-
264
-
265
-
266
-
267
-
268
-
269
-
270
-
271
-
272
-
273
-
274
-
275
-
276
-
277
-
278
-
279
-
280
-
281
-
282
-
283
-
284
-
285
-
286
-
287
-
288
-
289
-
290
-
291
-
292
-
293
-
294
-
295
-
296
-
297
-
298
-
299
-
300
-
301
-
302
-
303
-
304
-
305
-
306
-
307
-
308
-
309
-
310
-
311
-
312
-
313
-
314
-
315
-
316
-
317
-
318
-
319
-
320
-
321
-
322
-
323
-
324
-
325
-
326
-
327
-
328
-
329
-
330
-
331
-
332
-
333
-
334
-
335
-
336
-
337
-
338
-
339
-
340
-
341
-
342
-
343
-
344
-
345
-
346
-
347
-
348
-
349
-
350
-
351
-
352
-
353
-
354
-
355
-
356
-
357
-
358
-
359
-
360
-
361
-
362
-
363
-
364
-
365
-
366
-
367
-
368
-
369
-
370
-
371
-
372
-
373
-
374
-
375
-
376
-
377
-
378
-
379
-
380
-
381
-
382
-
383
-
384
-
385
-
386
 |
 |

Table of Contents
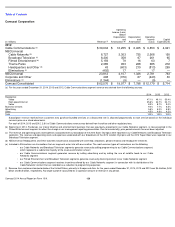
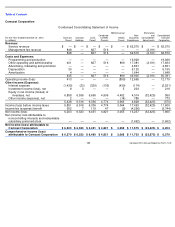
Comcast Corporation
(in millions)
Revenue
Operating
Income (Loss)
Before
Depreciation
and
Amortization
Depreciation
and
Amortization
Operating
Income
(Loss)
Capital
Expenditures
2012
Cable Communications
$
39,604
$
16,255
$
6,405
$
9,850
$
4,921
NBCUniversal
Cable Networks
8,727
3,303
735
2,568
150
Broadcast Television
8,200
358
97
261
65
Filmed Entertainment
5,159
79
16
63
7
Theme Parks
2,085
953
268
685
272
Headquarters and Other
43
(603
)
210
(813
)
269
Eliminations
(402
)
17
—
17
—
NBCUniversal
23,812
4,107
1,326
2,781
763
Corporate and Other
498
(376
)
67
(443
)
30
Eliminations
(1,344
)
(9
)
—
(
9
)
—
Comcast Consolidated
$
62,570
$
19,977
$
7,798
$
12,179
$
5,714
(a)
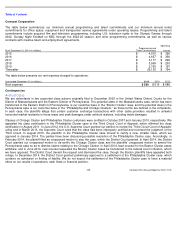
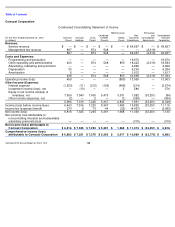
For the years ended December 31, 2014, 2013 and 2012, Cable Communications segment revenue was derived from the following sources:
2014
2013
2012
Residential:
Video
47.1
%
49.1
%
50.4
%
High
-
speed Internet
25.6
%
24.7
%
24.1
%
Voice
8.3
%
8.7
%
9.0
%
Business services
9.0
%
7.7
%
6.5
%
Advertising
5.5
%
5.2
%
5.8
%
Other
4.5
%
4.6
%
4.2
%
Total
100
%
100
%
100
%
Subscription revenue received from customers who purchase bundled services at a discounted rate is allocated proportionally to each service based on the individual
service
’
s price on a stand
-
alone basis.
For each of 2014, 2013 and 2012, 2.8% of Cable Communications revenue was derived from franchise and other regulatory fees.
(b)
Beginning in 2014, Fandango, our movie ticketing and entertainment business that was previously presented in our Cable Networks segment, is now presented in the
Filmed Entertainment segment to reflect the change in our management reporting presentation. Due to immateriality, prior period amounts have not been adjusted.
(c)
The revenue and operating costs and expenses associated with our broadcast of the 2014 Sochi Olympics were reported in our Cable Networks and Broadcast Television
segments. The revenue and operating costs and expenses associated with our broadcasts of the 2012 London Olympics and the 2012 Super Bowl were reported in our
Broadcast Television segment.
(d)
NBCUniversal Headquarters and Other activities include costs associated with overhead, allocations, personnel costs and headquarter initiatives.
(e)
Included in Eliminations are transactions that our segments enter into with one another. The most common types of transactions are the following:
•
our Cable Networks and Broadcast Television segments generate revenue by selling programming to our Cable Communications segment,
which represents a substantial majority of the revenue elimination amount
•
our Cable Communications segment generates revenue by selling advertising and by selling the use of satellite feeds to our Cable
Networks segment
•
our Filmed Entertainment and Broadcast Television segments generate revenue by licensing content to our Cable Networks segment
•
our Cable Communications segment receives incentives offered by our Cable Networks segment in connection with its distribution of the
Cable Networks
’
content that are recorded as a reduction to programming expenses
(f)
Revenue from customers located outside of the United States, primarily in Europe and Asia, for the years ended December 31, 2014, 2013 and 2012 was $4.4 billion, $4.8
billion and $4.5 billion, respectively. No single customer accounted for a significant amount of revenue in any period.
Comcast 2014 Annual Report on Form 10
-
K
120
(f) (g)
(a)
(b)
(c)
(b)
(d)
(e)
(e)