Comcast 2014 Annual Report Download - page 106
Download and view the complete annual report
Please find page 106 of the 2014 Comcast annual report below. You can navigate through the pages in the report by either clicking on the pages listed below, or by using the keyword search tool below to find specific information within the annual report.-
 1
1 -
2
-
3
-
4
-
5
-
6
-
7
-
8
-
9
-
10
-
11
-
12
-
13
-
14
-
15
-
16
-
17
-
18
-
19
-
20
-
21
-
22
-
23
-
24
-
25
-
26
-
27
-
28
-
29
-
30
-
31
-
32
-
33
-
34
-
35
-
36
-
37
-
38
-
39
-
40
-
41
-
42
-
43
-
44
-
45
-
46
-
47
-
48
-
49
-
50
-
51
-
52
-
53
-
54
-
55
-
56
-
57
-
58
-
59
-
60
-
61
-
62
-
63
-
64
-
65
-
66
-
67
-
68
-
69
-
70
-
71
-
72
-
73
-
74
-
75
-
76
-
77
-
78
-
79
-
80
-
81
-
82
-
83
-
84
-
85
-
86
-
87
-
88
-
89
-
90
-
91
-
92
-
93
-
94
-
95
-
 96
96 -
 97
97 -
 98
98 -
 99
99 -
 100
100 -
 101
101 -
 102
102 -
 103
103 -
 104
104 -
 105
105 -
 106
106 -
 107
107 -
 108
108 -
 109
109 -
 110
110 -
 111
111 -
 112
112 -
 113
113 -
 114
114 -
 115
115 -
 116
116 -
117
-
118
-
119
-
120
-
121
-
122
-
123
-
124
-
125
-
126
-
127
-
128
-
129
-
130
-
131
-
132
-
133
-
134
-
135
-
136
-
137
-
138
-
139
-
140
-
141
-
142
-
143
-
144
-
145
-
146
-
147
-
148
-
149
-
150
-
151
-
152
-
153
-
154
-
155
-
156
-
157
-
158
-
159
-
160
-
161
-
162
-
163
-
164
-
165
-
166
-
167
-
168
-
169
-
170
-
171
-
172
-
173
-
174
-
175
-
176
-
177
-
178
-
179
-
180
-
181
-
182
-
183
-
184
-
185
-
186
-
187
-
188
-
189
-
190
-
191
-
192
-
193
-
194
-
195
-
196
-
197
-
198
-
199
-
200
-
201
-
202
-
203
-
204
-
205
-
206
-
207
-
208
-
209
-
210
-
211
-
212
-
213
-
214
-
215
-
216
-
217
-
218
-
219
-
220
-
221
-
222
-
223
-
224
-
225
-
226
-
227
-
228
-
229
-
230
-
231
-
232
-
233
-
234
-
235
-
236
-
237
-
238
-
239
-
240
-
241
-
242
-
243
-
244
-
245
-
246
-
247
-
248
-
249
-
250
-
251
-
252
-
253
-
254
-
255
-
256
-
257
-
258
-
259
-
260
-
261
-
262
-
263
-
264
-
265
-
266
-
267
-
268
-
269
-
270
-
271
-
272
-
273
-
274
-
275
-
276
-
277
-
278
-
279
-
280
-
281
-
282
-
283
-
284
-
285
-
286
-
287
-
288
-
289
-
290
-
291
-
292
-
293
-
294
-
295
-
296
-
297
-
298
-
299
-
300
-
301
-
302
-
303
-
304
-
305
-
306
-
307
-
308
-
309
-
310
-
311
-
312
-
313
-
314
-
315
-
316
-
317
-
318
-
319
-
320
-
321
-
322
-
323
-
324
-
325
-
326
-
327
-
328
-
329
-
330
-
331
-
332
-
333
-
334
-
335
-
336
-
337
-
338
-
339
-
340
-
341
-
342
-
343
-
344
-
345
-
346
-
347
-
348
-
349
-
350
-
351
-
352
-
353
-
354
-
355
-
356
-
357
-
358
-
359
-
360
-
361
-
362
-
363
-
364
-
365
-
366
-
367
-
368
-
369
-
370
-
371
-
372
-
373
-
374
-
375
-
376
-
377
-
378
-
379
-
380
-
381
-
382
-
383
-
384
-
385
-
386
 |
 |

Table of Contents
Comcast Corporation
asset’
s estimated useful life. For assets that are sold or retired, we remove the applicable cost and accumulated depreciation and,
unless the gain or loss on disposition is presented separately, we recognize it as a component of depreciation expense.
We capitalize the costs associated with the construction of and improvements to our cable transmission and distribution facilities,
costs associated with acquiring and deploying new customer premise equipment, and costs associated with installation of our
services in accordance with accounting guidance related to cable television companies. Costs capitalized include all direct labor
and materials, as well as various indirect costs. All costs incurred in connection with subsequent disconnects and reconnects are
expensed as they are incurred.
We evaluate the recoverability of our property and equipment whenever events or substantive changes in circumstances indicate
that the carrying amount may not be recoverable. The evaluation is based on the cash flows generated by the underlying asset
groups, including estimated future operating results, trends or other determinants of fair value. If the total of the expected future
undiscounted cash flows were less than the carrying amount of the asset group, we would recognize an impairment charge to the
extent the carrying amount of the asset group exceeded its estimated fair value. Unless presented separately, the impairment
charge is included as a component of depreciation expense.
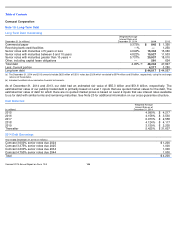
Acquisitions of Real Estate Properties
Real estate acquisitions in 2013 included NBCUniversal’
s purchase from GE of certain properties NBCUniversal occupies at 30
Rockefeller Plaza in New York City and CNBC’
s headquarters in Englewood Cliffs, New Jersey. The CNBC property was previously
recorded as a capital lease in our consolidated balance sheet. Other purchases in 2013 included NBCUniversal’
s acquisition of a
business whose primary asset is a property located at 10 Universal City Plaza, which is adjacent to our Universal theme park in
Hollywood, California, and our acquisition of an 80% interest in a business whose primary asset is our corporate headquarters in
Philadelphia, Pennsylvania. These purchases resulted in increases in 2013 of $2.2 billion in property and equipment, which are
included, as applicable, within the captions “buildings and leasehold improvements” and “land” in the table above.
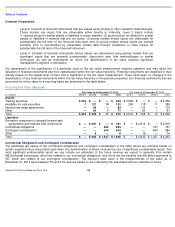
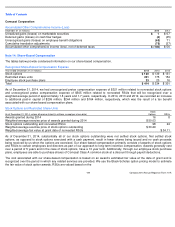
Note 9: Goodwill and Intangible Assets
Goodwill
We assess the recoverability of our goodwill annually, or more frequently whenever events or substantive changes in
circumstances indicate that the carrying amount of a reporting unit may exceed its fair value. We
NBCUniversal
(in millions)
Cable
Communications
Cable
Networks
Broadcast
Television
Filmed
Entertainment
Theme
Parks
Corporate
and Other
Total
Balance, December 31, 2012
$
12,206
$
13,026
$
761
$
1
$
982
$
9
$
26,985
Acquisitions
—
39
3
—
—
—
42
Adjustments
—
65
5
—
—
1
71
Balance, December 31, 2013
12,206
13,130
769
1
982
10
27,098
Acquisitions
11
20
—
15
—
181
227
Adjustments
—
(
202
)
(2
)
195
—
—
(
9
)
Balance, December 31, 2014
$
12,217
$
12,948
$
767
$
211
$
982
$
191
$
27,316
(a)
Adjustments to goodwill in 2014 were primarily related to the reclassification of Fandango, our movie ticketing and entertainment business, from our Cable Networks
segment to our Filmed Entertainment segment.
101
Comcast 2014 Annual Report on Form 10
-
K
(a)