Comcast 2014 Annual Report Download - page 124
Download and view the complete annual report
Please find page 124 of the 2014 Comcast annual report below. You can navigate through the pages in the report by either clicking on the pages listed below, or by using the keyword search tool below to find specific information within the annual report.-
 1
1 -
2
-
3
-
4
-
5
-
6
-
7
-
8
-
9
-
10
-
11
-
12
-
13
-
14
-
15
-
16
-
17
-
18
-
19
-
20
-
21
-
22
-
23
-
24
-
25
-
26
-
27
-
28
-
29
-
30
-
31
-
32
-
33
-
34
-
35
-
36
-
37
-
38
-
39
-
40
-
41
-
42
-
43
-
44
-
45
-
46
-
47
-
48
-
49
-
50
-
51
-
52
-
53
-
54
-
55
-
56
-
57
-
58
-
59
-
60
-
61
-
62
-
63
-
64
-
65
-
66
-
67
-
68
-
69
-
70
-
71
-
72
-
73
-
74
-
75
-
76
-
77
-
78
-
79
-
80
-
81
-
82
-
83
-
84
-
85
-
86
-
87
-
88
-
89
-
90
-
91
-
92
-
93
-
94
-
95
-
96
-
97
-
98
-
99
-
100
-
101
-
102
-
103
-
104
-
105
-
106
-
107
-
108
-
109
-
110
-
111
-
112
-
113
-
 114
114 -
 115
115 -
 116
116 -
 117
117 -
 118
118 -
 119
119 -
 120
120 -
 121
121 -
 122
122 -
 123
123 -
 124
124 -
 125
125 -
 126
126 -
 127
127 -
 128
128 -
 129
129 -
 130
130 -
 131
131 -
 132
132 -
 133
133 -
 134
134 -
135
-
136
-
137
-
138
-
139
-
140
-
141
-
142
-
143
-
144
-
145
-
146
-
147
-
148
-
149
-
150
-
151
-
152
-
153
-
154
-
155
-
156
-
157
-
158
-
159
-
160
-
161
-
162
-
163
-
164
-
165
-
166
-
167
-
168
-
169
-
170
-
171
-
172
-
173
-
174
-
175
-
176
-
177
-
178
-
179
-
180
-
181
-
182
-
183
-
184
-
185
-
186
-
187
-
188
-
189
-
190
-
191
-
192
-
193
-
194
-
195
-
196
-
197
-
198
-
199
-
200
-
201
-
202
-
203
-
204
-
205
-
206
-
207
-
208
-
209
-
210
-
211
-
212
-
213
-
214
-
215
-
216
-
217
-
218
-
219
-
220
-
221
-
222
-
223
-
224
-
225
-
226
-
227
-
228
-
229
-
230
-
231
-
232
-
233
-
234
-
235
-
236
-
237
-
238
-
239
-
240
-
241
-
242
-
243
-
244
-
245
-
246
-
247
-
248
-
249
-
250
-
251
-
252
-
253
-
254
-
255
-
256
-
257
-
258
-
259
-
260
-
261
-
262
-
263
-
264
-
265
-
266
-
267
-
268
-
269
-
270
-
271
-
272
-
273
-
274
-
275
-
276
-
277
-
278
-
279
-
280
-
281
-
282
-
283
-
284
-
285
-
286
-
287
-
288
-
289
-
290
-
291
-
292
-
293
-
294
-
295
-
296
-
297
-
298
-
299
-
300
-
301
-
302
-
303
-
304
-
305
-
306
-
307
-
308
-
309
-
310
-
311
-
312
-
313
-
314
-
315
-
316
-
317
-
318
-
319
-
320
-
321
-
322
-
323
-
324
-
325
-
326
-
327
-
328
-
329
-
330
-
331
-
332
-
333
-
334
-
335
-
336
-
337
-
338
-
339
-
340
-
341
-
342
-
343
-
344
-
345
-
346
-
347
-
348
-
349
-
350
-
351
-
352
-
353
-
354
-
355
-
356
-
357
-
358
-
359
-
360
-
361
-
362
-
363
-
364
-
365
-
366
-
367
-
368
-
369
-
370
-
371
-
372
-
373
-
374
-
375
-
376
-
377
-
378
-
379
-
380
-
381
-
382
-
383
-
384
-
385
-
386
 |
 |

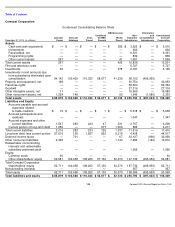
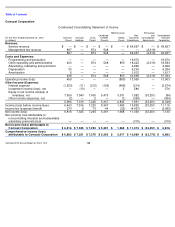
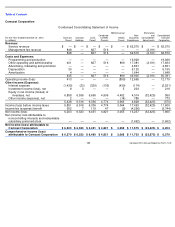
Table of Contents
Comcast Corporation
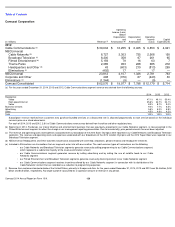
Note 18: Financial Data by Business Segment
We present our operations in one reportable business segment for Cable Communications and four reportable business segments
for NBCUniversal. The Cable Networks, Broadcast Television, Filmed Entertainment and Theme Parks segments comprise the
NBCUniversal businesses and are collectively referred to as the NBCUniversal segments. Our financial data by reportable business
segment is presented in the tables below.
(in millions)
Revenue
Operating
Income (Loss)
Before
Depreciation
and
Amortization
Depreciation
and
Amortization
Operating
Income
(Loss)
Capital
Expenditures
Assets
2014
Cable Communications
$
44,140
$
18,112
$
6,422
$
11,690
$
6,154
$
140,616
NBCUniversal
Cable Networks
9,563
3,589
748
2,841
49
28,582
Broadcast Television
8,542
734
127
607
76
6,806
Filmed Entertainment
5,008
711
21
690
11
4,185
Theme Parks
2,623
1,168
273
895
671
7,017
Headquarters and Other
13
(613
)
326
(939
)
414
6,479
Eliminations
(321
)
(1
)
—
(
1
)
—
(
452
)
NBCUniversal
25,428
5,588
1,495
4,093
1,221
52,617
Corporate and Other
709
(778
)
102
(880
)
45
5,338
Eliminations
(1,502
)
1
—
1
—
(
39,232
)
Comcast Consolidated
$
68,775
$
22,923
$
8,019
$
14,904
$
7,420
$
159,339
(in millions)
Revenue
Operating
Income (Loss)
Before
Depreciation
and
Amortization
Depreciation
and
Amortization
Operating
Income
(Loss)
Capital
Expenditures
Assets
2013
Cable Communications
$
41,836
$
17,205
$
6,394
$
10,811
$
5,403
$
132,082
NBCUniversal
Cable Networks
9,201
3,501
734
2,767
67
29,413
Broadcast Television
7,120
345
98
247
65
6,723
Filmed Entertainment
5,452
483
15
468
9
3,549
Theme Parks
2,235
1,004
300
704
580
6,608
Headquarters and Other
31
(588
)
264
(852
)
439
6,002
Eliminations
(389
)
(13
)
—
(
13
)
—
(
556
)
NBCUniversal
23,650
4,732
1,411
3,321
1,160
51,739
Corporate and Other
600
(489
)
66
(555
)
33
8,152
Eliminations
(1,429
)
(14
)
—
(
14
)
—
(
33,160
)
Comcast Consolidated
$
64,657
$
21,434
$
7,871
$
13,563
$
6,596
$
158,813
119
Comcast 2014 Annual Report on Form 10
-
K
(f)
(g)
(a)
(b)(c)
(c)
(b)
(d)
(e)
(e)
(f)
(g)
(a)
(b)
(b)
(d)
(e)
(e)