Comcast 2014 Annual Report Download - page 65
Download and view the complete annual report
Please find page 65 of the 2014 Comcast annual report below. You can navigate through the pages in the report by either clicking on the pages listed below, or by using the keyword search tool below to find specific information within the annual report.-
 1
1 -
2
-
3
-
4
-
5
-
6
-
7
-
8
-
9
-
10
-
11
-
12
-
13
-
14
-
15
-
16
-
17
-
18
-
19
-
20
-
21
-
22
-
23
-
24
-
25
-
26
-
27
-
28
-
29
-
30
-
31
-
32
-
33
-
34
-
35
-
36
-
37
-
38
-
39
-
40
-
41
-
42
-
43
-
44
-
45
-
46
-
47
-
48
-
49
-
50
-
51
-
52
-
53
-
54
-
 55
55 -
 56
56 -
 57
57 -
 58
58 -
 59
59 -
 60
60 -
 61
61 -
 62
62 -
 63
63 -
 64
64 -
 65
65 -
 66
66 -
 67
67 -
 68
68 -
 69
69 -
 70
70 -
 71
71 -
 72
72 -
 73
73 -
 74
74 -
 75
75 -
76
-
77
-
78
-
79
-
80
-
81
-
82
-
83
-
84
-
85
-
86
-
87
-
88
-
89
-
90
-
91
-
92
-
93
-
94
-
95
-
96
-
97
-
98
-
99
-
100
-
101
-
102
-
103
-
104
-
105
-
106
-
107
-
108
-
109
-
110
-
111
-
112
-
113
-
114
-
115
-
116
-
117
-
118
-
119
-
120
-
121
-
122
-
123
-
124
-
125
-
126
-
127
-
128
-
129
-
130
-
131
-
132
-
133
-
134
-
135
-
136
-
137
-
138
-
139
-
140
-
141
-
142
-
143
-
144
-
145
-
146
-
147
-
148
-
149
-
150
-
151
-
152
-
153
-
154
-
155
-
156
-
157
-
158
-
159
-
160
-
161
-
162
-
163
-
164
-
165
-
166
-
167
-
168
-
169
-
170
-
171
-
172
-
173
-
174
-
175
-
176
-
177
-
178
-
179
-
180
-
181
-
182
-
183
-
184
-
185
-
186
-
187
-
188
-
189
-
190
-
191
-
192
-
193
-
194
-
195
-
196
-
197
-
198
-
199
-
200
-
201
-
202
-
203
-
204
-
205
-
206
-
207
-
208
-
209
-
210
-
211
-
212
-
213
-
214
-
215
-
216
-
217
-
218
-
219
-
220
-
221
-
222
-
223
-
224
-
225
-
226
-
227
-
228
-
229
-
230
-
231
-
232
-
233
-
234
-
235
-
236
-
237
-
238
-
239
-
240
-
241
-
242
-
243
-
244
-
245
-
246
-
247
-
248
-
249
-
250
-
251
-
252
-
253
-
254
-
255
-
256
-
257
-
258
-
259
-
260
-
261
-
262
-
263
-
264
-
265
-
266
-
267
-
268
-
269
-
270
-
271
-
272
-
273
-
274
-
275
-
276
-
277
-
278
-
279
-
280
-
281
-
282
-
283
-
284
-
285
-
286
-
287
-
288
-
289
-
290
-
291
-
292
-
293
-
294
-
295
-
296
-
297
-
298
-
299
-
300
-
301
-
302
-
303
-
304
-
305
-
306
-
307
-
308
-
309
-
310
-
311
-
312
-
313
-
314
-
315
-
316
-
317
-
318
-
319
-
320
-
321
-
322
-
323
-
324
-
325
-
326
-
327
-
328
-
329
-
330
-
331
-
332
-
333
-
334
-
335
-
336
-
337
-
338
-
339
-
340
-
341
-
342
-
343
-
344
-
345
-
346
-
347
-
348
-
349
-
350
-
351
-
352
-
353
-
354
-
355
-
356
-
357
-
358
-
359
-
360
-
361
-
362
-
363
-
364
-
365
-
366
-
367
-
368
-
369
-
370
-
371
-
372
-
373
-
374
-
375
-
376
-
377
-
378
-
379
-
380
-
381
-
382
-
383
-
384
-
385
-
386
 |
 |

Table of Contents
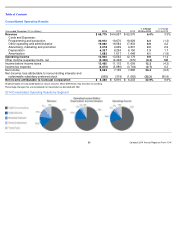
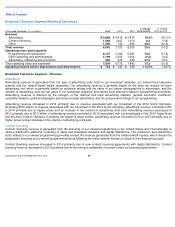
Cable Communications Segment – Operating Costs and Expenses
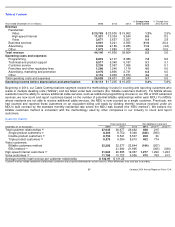
We continue to focus on controlling the growth of expenses. Our operating margin, which is our operating income before
depreciation and amortization as a percentage of revenue, for 2014, 2013 and 2012 was 41.0%, 41.1% and 41.0%, respectively.
Programming Expenses
Programming expenses, which represent our largest operating expense, are the fees we pay to license the programming we
distribute to our video customers. These expenses are affected by the programming license fees charged by cable networks, the
fees charged for retransmission of the signals from local broadcast television stations, the number of video customers we serve and
the amount of content we provide. Programming expenses increased in 2014 and 2013 primarily due to increases in programming
license fees, including retransmission consent fees and sports programming costs, and fees to secure rights for additional
programming for our customers across an increasing number of platforms.
We anticipate that our programming expenses will continue to increase as we provide additional content, including in HD, to our
video customers; as we deliver this content through an increasing number of platforms, including On Demand, online and through
our mobile apps; and as the fees we pay increase, primarily retransmission consent fees and sports programming costs. We
believe that adding more content and delivering it on various platforms will help us to attract and retain video customers.
Technical and Product Support Expenses
Technical and product support expenses include costs to complete service call and installation activities, as well as costs for
network operations, product development, fulfillment and provisioning. Technical and product support expenses increased in 2014
and 2013 primarily due to expenses related to the development, delivery and support of our enhanced devices and services,
including our X1 platform, Cloud DVR technology and wireless gateways, and the continued growth in business services. The
increase in 2014 was also due to expenses related to our home security and automation services and the increase in 2013 was
also due to customer fulfillment activities.
Customer Service Expenses
Customer service expenses include the personnel and other costs associated with handling the sale of services to customers and
customer service activity. Customer service expenses increased in 2014 and 2013 primarily due to increases in total labor costs
associated with increases in customer service activity. The increases in customer service activity were primarily due to sales and
related support activities associated with the continued deployment of enhanced devices and services, which include our X1
platform, Cloud DVR technology, wireless gateways, and home security and
automation services, and the continued growth in
business services.
Franchise and Other Regulatory Fees
Franchise and other regulatory fees increased in 2014 and 2013 primarily due to increases in revenue from residential cable
services and business services related to the fees we are required to pay to federal, state and local authorities.
Advertising, Marketing and Promotion Expenses
Advertising, marketing and promotion expenses increased in 2014 and 2013 primarily due to increases in spending associated with
attracting new residential and business services customers and encouraging existing customers to add additional or higher-
tier
services.
Other Costs and Expenses
Other costs and expenses increased in 2014 and 2013 primarily due to increases in costs to support our advertising sales
business, as well as increases in other administrative costs.
Comcast 2014 Annual Report on Form 10
-
K
60