Comcast 2014 Annual Report Download - page 117
Download and view the complete annual report
Please find page 117 of the 2014 Comcast annual report below. You can navigate through the pages in the report by either clicking on the pages listed below, or by using the keyword search tool below to find specific information within the annual report.-
 1
1 -
2
-
3
-
4
-
5
-
6
-
7
-
8
-
9
-
10
-
11
-
12
-
13
-
14
-
15
-
16
-
17
-
18
-
19
-
20
-
21
-
22
-
23
-
24
-
25
-
26
-
27
-
28
-
29
-
30
-
31
-
32
-
33
-
34
-
35
-
36
-
37
-
38
-
39
-
40
-
41
-
42
-
43
-
44
-
45
-
46
-
47
-
48
-
49
-
50
-
51
-
52
-
53
-
54
-
55
-
56
-
57
-
58
-
59
-
60
-
61
-
62
-
63
-
64
-
65
-
66
-
67
-
68
-
69
-
70
-
71
-
72
-
73
-
74
-
75
-
76
-
77
-
78
-
79
-
80
-
81
-
82
-
83
-
84
-
85
-
86
-
87
-
88
-
89
-
90
-
91
-
92
-
93
-
94
-
95
-
96
-
97
-
98
-
99
-
100
-
101
-
102
-
103
-
104
-
105
-
106
-
 107
107 -
 108
108 -
 109
109 -
 110
110 -
 111
111 -
 112
112 -
 113
113 -
 114
114 -
 115
115 -
 116
116 -
 117
117 -
 118
118 -
 119
119 -
 120
120 -
 121
121 -
 122
122 -
 123
123 -
 124
124 -
 125
125 -
 126
126 -
 127
127 -
128
-
129
-
130
-
131
-
132
-
133
-
134
-
135
-
136
-
137
-
138
-
139
-
140
-
141
-
142
-
143
-
144
-
145
-
146
-
147
-
148
-
149
-
150
-
151
-
152
-
153
-
154
-
155
-
156
-
157
-
158
-
159
-
160
-
161
-
162
-
163
-
164
-
165
-
166
-
167
-
168
-
169
-
170
-
171
-
172
-
173
-
174
-
175
-
176
-
177
-
178
-
179
-
180
-
181
-
182
-
183
-
184
-
185
-
186
-
187
-
188
-
189
-
190
-
191
-
192
-
193
-
194
-
195
-
196
-
197
-
198
-
199
-
200
-
201
-
202
-
203
-
204
-
205
-
206
-
207
-
208
-
209
-
210
-
211
-
212
-
213
-
214
-
215
-
216
-
217
-
218
-
219
-
220
-
221
-
222
-
223
-
224
-
225
-
226
-
227
-
228
-
229
-
230
-
231
-
232
-
233
-
234
-
235
-
236
-
237
-
238
-
239
-
240
-
241
-
242
-
243
-
244
-
245
-
246
-
247
-
248
-
249
-
250
-
251
-
252
-
253
-
254
-
255
-
256
-
257
-
258
-
259
-
260
-
261
-
262
-
263
-
264
-
265
-
266
-
267
-
268
-
269
-
270
-
271
-
272
-
273
-
274
-
275
-
276
-
277
-
278
-
279
-
280
-
281
-
282
-
283
-
284
-
285
-
286
-
287
-
288
-
289
-
290
-
291
-
292
-
293
-
294
-
295
-
296
-
297
-
298
-
299
-
300
-
301
-
302
-
303
-
304
-
305
-
306
-
307
-
308
-
309
-
310
-
311
-
312
-
313
-
314
-
315
-
316
-
317
-
318
-
319
-
320
-
321
-
322
-
323
-
324
-
325
-
326
-
327
-
328
-
329
-
330
-
331
-
332
-
333
-
334
-
335
-
336
-
337
-
338
-
339
-
340
-
341
-
342
-
343
-
344
-
345
-
346
-
347
-
348
-
349
-
350
-
351
-
352
-
353
-
354
-
355
-
356
-
357
-
358
-
359
-
360
-
361
-
362
-
363
-
364
-
365
-
366
-
367
-
368
-
369
-
370
-
371
-
372
-
373
-
374
-
375
-
376
-
377
-
378
-
379
-
380
-
381
-
382
-
383
-
384
-
385
-
386
 |
 |

Table of Contents
Comcast Corporation
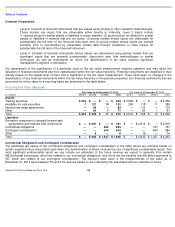
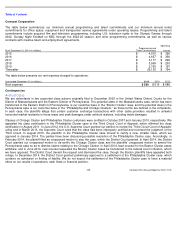
closing price of our Class A common stock on the date of grant and are discounted for the lack of dividends, if any, during the
vesting period. The table below presents the weighted-
average fair value on the date of grant of RSUs and Class A common stock
options awarded under our various plans and the related weighted-average valuation assumptions.
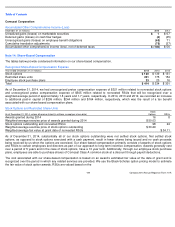
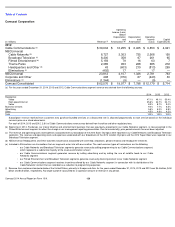
Note 15: Income Taxes
Components of Income Tax Expense
Our income tax expense differs from the federal statutory amount because of the effect of the items detailed in the table below.
We base our provision for income taxes on our current period income, changes in our deferred income tax assets and liabilities,
income tax rates, changes in estimates of our uncertain tax positions, and tax planning opportunities available in the jurisdictions in
which we operate. We recognize deferred tax assets and
Year ended December 31
2014
2013
2012
RSUs fair value
$
47.91
$
38.28
$
27.80
Stock options fair value
$
11.11
$
8.80
$
7.38
Stock Option Valuation Assumptions:
Dividend yield
1.8
%
1.9
%
2.2
%
Expected volatility
24.0
%
25.0
%
29.0
%
Risk-free interest rate
2.2
%
1.3
%
1.7
%
Expected option life (in years)
6.5
7.0
7.0
Year ended December 31 (in millions)
2014
2013
2012
Current Expense (Benefit):
Federal
$
2,392
$
3,183
$
3,004
State
174
581
432
Foreign
142
200
169
2,708
3,964
3,605
Deferred Expense (Benefit):
Federal
1,000
(76
)
160
State
173
108
(40
)
Foreign
(8
)
(16
)
19
1,165
16
139
Income tax expense
$
3,873
$
3,980
$
3,744
Year ended December 31 (in millions)
2014
2013
2012
Federal tax at statutory rate
$
4,363
$
3,890
$
4,063
State income taxes, net of federal benefit
329
319
178
Foreign income taxes, net of federal credit
—
15
92
Nontaxable income attributable to noncontrolling interests
(62
)
(103
)
(620
)
Adjustments to uncertain and effectively settled tax positions, net
(408
)
58
114
Accrued interest on uncertain and effectively settled tax positions, net
(235
)
114
23
Other
(114
)
(313
)
(106
)
Income tax expense
$
3,873
$
3,980
$
3,744
Comcast 2014 Annual Report on Form 10-K
112