Comcast 2014 Annual Report Download - page 74
Download and view the complete annual report
Please find page 74 of the 2014 Comcast annual report below. You can navigate through the pages in the report by either clicking on the pages listed below, or by using the keyword search tool below to find specific information within the annual report.-
 1
1 -
2
-
3
-
4
-
5
-
6
-
7
-
8
-
9
-
10
-
11
-
12
-
13
-
14
-
15
-
16
-
17
-
18
-
19
-
20
-
21
-
22
-
23
-
24
-
25
-
26
-
27
-
28
-
29
-
30
-
31
-
32
-
33
-
34
-
35
-
36
-
37
-
38
-
39
-
40
-
41
-
42
-
43
-
44
-
45
-
46
-
47
-
48
-
49
-
50
-
51
-
52
-
53
-
54
-
55
-
56
-
57
-
58
-
59
-
60
-
61
-
62
-
63
-
 64
64 -
 65
65 -
 66
66 -
 67
67 -
 68
68 -
 69
69 -
 70
70 -
 71
71 -
 72
72 -
 73
73 -
 74
74 -
 75
75 -
 76
76 -
 77
77 -
 78
78 -
 79
79 -
 80
80 -
 81
81 -
 82
82 -
 83
83 -
 84
84 -
85
-
86
-
87
-
88
-
89
-
90
-
91
-
92
-
93
-
94
-
95
-
96
-
97
-
98
-
99
-
100
-
101
-
102
-
103
-
104
-
105
-
106
-
107
-
108
-
109
-
110
-
111
-
112
-
113
-
114
-
115
-
116
-
117
-
118
-
119
-
120
-
121
-
122
-
123
-
124
-
125
-
126
-
127
-
128
-
129
-
130
-
131
-
132
-
133
-
134
-
135
-
136
-
137
-
138
-
139
-
140
-
141
-
142
-
143
-
144
-
145
-
146
-
147
-
148
-
149
-
150
-
151
-
152
-
153
-
154
-
155
-
156
-
157
-
158
-
159
-
160
-
161
-
162
-
163
-
164
-
165
-
166
-
167
-
168
-
169
-
170
-
171
-
172
-
173
-
174
-
175
-
176
-
177
-
178
-
179
-
180
-
181
-
182
-
183
-
184
-
185
-
186
-
187
-
188
-
189
-
190
-
191
-
192
-
193
-
194
-
195
-
196
-
197
-
198
-
199
-
200
-
201
-
202
-
203
-
204
-
205
-
206
-
207
-
208
-
209
-
210
-
211
-
212
-
213
-
214
-
215
-
216
-
217
-
218
-
219
-
220
-
221
-
222
-
223
-
224
-
225
-
226
-
227
-
228
-
229
-
230
-
231
-
232
-
233
-
234
-
235
-
236
-
237
-
238
-
239
-
240
-
241
-
242
-
243
-
244
-
245
-
246
-
247
-
248
-
249
-
250
-
251
-
252
-
253
-
254
-
255
-
256
-
257
-
258
-
259
-
260
-
261
-
262
-
263
-
264
-
265
-
266
-
267
-
268
-
269
-
270
-
271
-
272
-
273
-
274
-
275
-
276
-
277
-
278
-
279
-
280
-
281
-
282
-
283
-
284
-
285
-
286
-
287
-
288
-
289
-
290
-
291
-
292
-
293
-
294
-
295
-
296
-
297
-
298
-
299
-
300
-
301
-
302
-
303
-
304
-
305
-
306
-
307
-
308
-
309
-
310
-
311
-
312
-
313
-
314
-
315
-
316
-
317
-
318
-
319
-
320
-
321
-
322
-
323
-
324
-
325
-
326
-
327
-
328
-
329
-
330
-
331
-
332
-
333
-
334
-
335
-
336
-
337
-
338
-
339
-
340
-
341
-
342
-
343
-
344
-
345
-
346
-
347
-
348
-
349
-
350
-
351
-
352
-
353
-
354
-
355
-
356
-
357
-
358
-
359
-
360
-
361
-
362
-
363
-
364
-
365
-
366
-
367
-
368
-
369
-
370
-
371
-
372
-
373
-
374
-
375
-
376
-
377
-
378
-
379
-
380
-
381
-
382
-
383
-
384
-
385
-
386
 |
 |

Table of Contents
Corporate and Other – Revenue
Other revenue primarily relates to Comcast-
Spectacor, which owns the Philadelphia Flyers and the Wells Fargo Center arena in
Philadelphia, Pennsylvania and operates arena management-related businesses.
Other revenue increased in 2014 primarily due to an increase in revenue from food services associated with new contracts entered
into by one of our Comcast-
Spectacor businesses, as well as an increase in revenue associated with newly acquired businesses.
Other revenue increased in 2013 primarily due to an increase in the number of NHL games compared to 2012 due to the NHL
lockout in 2012.
Corporate and Other – Operating Costs and Expenses
Corporate and Other operating costs and expenses primarily include overhead, personnel costs, the cost of corporate initiatives
and branding, and operating costs and expenses associated with Comcast-Spectacor.
Corporate and Other operating costs and expenses increased in 2014 primarily due to $237 million of transaction-
related costs
associated with the Time Warner Cable merger and the divestiture transactions, as well as an increase in operating costs and
expenses associated with new contracts entered into by one of our Comcast-
Spectacor businesses. Corporate and Other operating
costs and expenses also increased due to $25 million of costs associated with the 2014 Sochi Olympics. Corporate and Other
operating costs and expenses increased in 2013 primarily due to $74 million of expenses associated with the final settlement of the
terminated qualified pension plan that provided benefits to former employees of a company we acquired as part of the AT&T
Broadband transaction in 2002, as well as an increase in labor costs in our Comcast-Spectacor business.
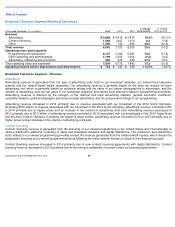
Consolidated Other Income (Expense) Items, Net
Interest Expense
Interest expense increased in 2014 primarily due to the effects of our interest rate derivative financial instruments. Interest expense
increased in 2013 primarily due to an increase in our debt outstanding, partially offset by a lower average cost of debt.
Investment Income (Loss), Net
The changes in investment income (loss), net in 2014 and 2013 were primarily due to the $443 million gain that was recorded in
2013 related to the sale of our investment in Clearwire Corporation in July 2013. The components of investment income (loss), net
in 2014, 2013 and 2012 are presented in a table in Note 7 to Comcast’s consolidated financial statements.
Equity in Net Income (Losses) of Investees, Net
The change in equity in net income (loss) of investees, net in 2014 was primarily due to $142 million of total equity losses recorded
in 2013 attributable to our investment in Hulu, LLC (“Hulu”).
In July 2013, we entered into an agreement to provide capital
contributions totaling $247 million to Hulu, which we had previously accounted for as a cost method investment. This represented
an agreement to provide our first capital contribution to Hulu since we acquired our interest in it as part of our acquisition of a
controlling interest in NBCUniversal, LLC (“NBCUniversal Holdings”) in 2011 (the “NBCUniversal transaction”); therefore, we began
Year ended December 31 (in millions)
2014
2013
2012
Interest expense
$
(2,617
)
$
(2,574
)
$
(2,521
)
Investment income (loss), net
296
576
219
Equity in net income (losses) of investees, net
97
(86
)
959
Other income (expense), net
(215
)
(364
)
773
Total
$
(2,439
)
$
(2,448
)
$
(570
)
69
Comcast 2014 Annual Report on Form 10-
K