Comcast 2014 Annual Report Download - page 62
Download and view the complete annual report
Please find page 62 of the 2014 Comcast annual report below. You can navigate through the pages in the report by either clicking on the pages listed below, or by using the keyword search tool below to find specific information within the annual report.-
 1
1 -
2
-
3
-
4
-
5
-
6
-
7
-
8
-
9
-
10
-
11
-
12
-
13
-
14
-
15
-
16
-
17
-
18
-
19
-
20
-
21
-
22
-
23
-
24
-
25
-
26
-
27
-
28
-
29
-
30
-
31
-
32
-
33
-
34
-
35
-
36
-
37
-
38
-
39
-
40
-
41
-
42
-
43
-
44
-
45
-
46
-
47
-
48
-
49
-
50
-
51
-
 52
52 -
 53
53 -
 54
54 -
 55
55 -
 56
56 -
 57
57 -
 58
58 -
 59
59 -
 60
60 -
 61
61 -
 62
62 -
 63
63 -
 64
64 -
 65
65 -
 66
66 -
 67
67 -
 68
68 -
 69
69 -
 70
70 -
 71
71 -
 72
72 -
73
-
74
-
75
-
76
-
77
-
78
-
79
-
80
-
81
-
82
-
83
-
84
-
85
-
86
-
87
-
88
-
89
-
90
-
91
-
92
-
93
-
94
-
95
-
96
-
97
-
98
-
99
-
100
-
101
-
102
-
103
-
104
-
105
-
106
-
107
-
108
-
109
-
110
-
111
-
112
-
113
-
114
-
115
-
116
-
117
-
118
-
119
-
120
-
121
-
122
-
123
-
124
-
125
-
126
-
127
-
128
-
129
-
130
-
131
-
132
-
133
-
134
-
135
-
136
-
137
-
138
-
139
-
140
-
141
-
142
-
143
-
144
-
145
-
146
-
147
-
148
-
149
-
150
-
151
-
152
-
153
-
154
-
155
-
156
-
157
-
158
-
159
-
160
-
161
-
162
-
163
-
164
-
165
-
166
-
167
-
168
-
169
-
170
-
171
-
172
-
173
-
174
-
175
-
176
-
177
-
178
-
179
-
180
-
181
-
182
-
183
-
184
-
185
-
186
-
187
-
188
-
189
-
190
-
191
-
192
-
193
-
194
-
195
-
196
-
197
-
198
-
199
-
200
-
201
-
202
-
203
-
204
-
205
-
206
-
207
-
208
-
209
-
210
-
211
-
212
-
213
-
214
-
215
-
216
-
217
-
218
-
219
-
220
-
221
-
222
-
223
-
224
-
225
-
226
-
227
-
228
-
229
-
230
-
231
-
232
-
233
-
234
-
235
-
236
-
237
-
238
-
239
-
240
-
241
-
242
-
243
-
244
-
245
-
246
-
247
-
248
-
249
-
250
-
251
-
252
-
253
-
254
-
255
-
256
-
257
-
258
-
259
-
260
-
261
-
262
-
263
-
264
-
265
-
266
-
267
-
268
-
269
-
270
-
271
-
272
-
273
-
274
-
275
-
276
-
277
-
278
-
279
-
280
-
281
-
282
-
283
-
284
-
285
-
286
-
287
-
288
-
289
-
290
-
291
-
292
-
293
-
294
-
295
-
296
-
297
-
298
-
299
-
300
-
301
-
302
-
303
-
304
-
305
-
306
-
307
-
308
-
309
-
310
-
311
-
312
-
313
-
314
-
315
-
316
-
317
-
318
-
319
-
320
-
321
-
322
-
323
-
324
-
325
-
326
-
327
-
328
-
329
-
330
-
331
-
332
-
333
-
334
-
335
-
336
-
337
-
338
-
339
-
340
-
341
-
342
-
343
-
344
-
345
-
346
-
347
-
348
-
349
-
350
-
351
-
352
-
353
-
354
-
355
-
356
-
357
-
358
-
359
-
360
-
361
-
362
-
363
-
364
-
365
-
366
-
367
-
368
-
369
-
370
-
371
-
372
-
373
-
374
-
375
-
376
-
377
-
378
-
379
-
380
-
381
-
382
-
383
-
384
-
385
-
386
 |
 |

Table of Contents
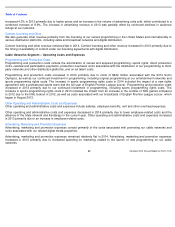
Beginning in 2014, our Cable Communications segment revised the methodology it uses for counting and reporting customers who
reside in multiple dwelling units (“MDUs”) and are billed under bulk contracts (the “billable customers method”).
For MDUs whose
residents have the ability to receive additional cable services, such as additional programming choices or our HD or DVR advanced
services, we now count and report customers based on the number of potential billable relationships within each MDU. For MDUs
whose residents are not able to receive additional cable services, the MDU is now counted as a single customer. Previously, we
had counted and reported these customers on an equivalent billing unit basis by dividing monthly revenue received under an
MDU’s bulk contract by the standard monthly residential rate where the MDU was located (the “EBU method”).
We believe the
billable customers method is consistent with the methodology used by other companies in our industry to count and report
customers.
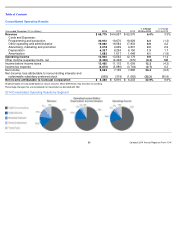
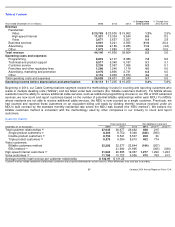
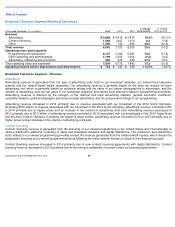
Customer Metrics
Customer metrics include residential and business customers and are presented based on actual amounts. Minor differences may exist due to rounding.
Year ended December 31 (in millions)
2014
2013
2012
% Change from
2013 to 2014
% Change from
2012 to 2013
Revenue
Residential:
Video
$
20,783
$
20,535
$
19,952
1.2
%
2.9
%
High-speed Internet
11,321
10,334
9,544
9.5
8.3
Voice
3,671
3,657
3,557
0.4
2.8
Business services
3,951
3,241
2,565
21.9
26.4
Advertising
2,442
2,189
2,284
11.5
(4.2
)
Other
1,972
1,880
1,702
4.9
10.5
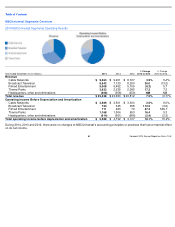
Total revenue
44,140
41,836
39,604
5.5
5.6
Operating costs and expenses
Programming
9,819
9,107
8,386
7.8
8.6
Technical and product support
5,517
5,349
5,187
3.1
3.1
Customer service
2,205
2,097
1,995
5.2
5.1
Franchise and other regulatory fees
1,296
1,246
1,176
4.0
6.0
Advertising, marketing and promotion
3,075
2,896
2,731
6.2
6.0
Other
4,116
3,936
3,874
4.6
1.6
Total operating costs and expenses
26,028
24,631
23,349
5.7
5.5
Operating income before depreciation and amortization
$
18,112
$
17,205
$
16,255
5.3
%
5.8
%
Total Customers
Net Additional Customers
December 31 (in thousands)
2014
2013
2012
2014
2013
2012
Total customer relationships
27,035
26,677
26,462
358
215
Single product customers
8,409
8,752
9,346
(343
)
(593
)
Double product customers
8,750
8,541
8,507
209
34
Triple product customers
9,876
9,384
8,610
492
774
Video customers:
Billable customers method
22,383
22,577
22,844
(194
)
(267
)
EBU method
21,690
21,995
(305
)
(336
)
High-speed Internet customers
21,962
20,685
19,367
1,277
1,296
1,223
Voice customers
11,193
10,723
9,955
470
768
613
Average monthly total revenue per customer relationship
$
136.97
$
131.22
57
Comcast 2014 Annual Report on Form 10
-
K
(a) (a)
(b)
(b)
(b)
(b)
(c)
(d)
(d)