Comcast 2014 Annual Report Download - page 50
Download and view the complete annual report
Please find page 50 of the 2014 Comcast annual report below. You can navigate through the pages in the report by either clicking on the pages listed below, or by using the keyword search tool below to find specific information within the annual report.-
 1
1 -
2
-
3
-
4
-
5
-
6
-
7
-
8
-
9
-
10
-
11
-
12
-
13
-
14
-
15
-
16
-
17
-
18
-
19
-
20
-
21
-
22
-
23
-
24
-
25
-
26
-
27
-
28
-
29
-
30
-
31
-
32
-
33
-
34
-
35
-
36
-
37
-
38
-
39
-
 40
40 -
 41
41 -
 42
42 -
 43
43 -
 44
44 -
 45
45 -
 46
46 -
 47
47 -
 48
48 -
 49
49 -
 50
50 -
 51
51 -
 52
52 -
 53
53 -
 54
54 -
 55
55 -
 56
56 -
 57
57 -
 58
58 -
 59
59 -
 60
60 -
61
-
62
-
63
-
64
-
65
-
66
-
67
-
68
-
69
-
70
-
71
-
72
-
73
-
74
-
75
-
76
-
77
-
78
-
79
-
80
-
81
-
82
-
83
-
84
-
85
-
86
-
87
-
88
-
89
-
90
-
91
-
92
-
93
-
94
-
95
-
96
-
97
-
98
-
99
-
100
-
101
-
102
-
103
-
104
-
105
-
106
-
107
-
108
-
109
-
110
-
111
-
112
-
113
-
114
-
115
-
116
-
117
-
118
-
119
-
120
-
121
-
122
-
123
-
124
-
125
-
126
-
127
-
128
-
129
-
130
-
131
-
132
-
133
-
134
-
135
-
136
-
137
-
138
-
139
-
140
-
141
-
142
-
143
-
144
-
145
-
146
-
147
-
148
-
149
-
150
-
151
-
152
-
153
-
154
-
155
-
156
-
157
-
158
-
159
-
160
-
161
-
162
-
163
-
164
-
165
-
166
-
167
-
168
-
169
-
170
-
171
-
172
-
173
-
174
-
175
-
176
-
177
-
178
-
179
-
180
-
181
-
182
-
183
-
184
-
185
-
186
-
187
-
188
-
189
-
190
-
191
-
192
-
193
-
194
-
195
-
196
-
197
-
198
-
199
-
200
-
201
-
202
-
203
-
204
-
205
-
206
-
207
-
208
-
209
-
210
-
211
-
212
-
213
-
214
-
215
-
216
-
217
-
218
-
219
-
220
-
221
-
222
-
223
-
224
-
225
-
226
-
227
-
228
-
229
-
230
-
231
-
232
-
233
-
234
-
235
-
236
-
237
-
238
-
239
-
240
-
241
-
242
-
243
-
244
-
245
-
246
-
247
-
248
-
249
-
250
-
251
-
252
-
253
-
254
-
255
-
256
-
257
-
258
-
259
-
260
-
261
-
262
-
263
-
264
-
265
-
266
-
267
-
268
-
269
-
270
-
271
-
272
-
273
-
274
-
275
-
276
-
277
-
278
-
279
-
280
-
281
-
282
-
283
-
284
-
285
-
286
-
287
-
288
-
289
-
290
-
291
-
292
-
293
-
294
-
295
-
296
-
297
-
298
-
299
-
300
-
301
-
302
-
303
-
304
-
305
-
306
-
307
-
308
-
309
-
310
-
311
-
312
-
313
-
314
-
315
-
316
-
317
-
318
-
319
-
320
-
321
-
322
-
323
-
324
-
325
-
326
-
327
-
328
-
329
-
330
-
331
-
332
-
333
-
334
-
335
-
336
-
337
-
338
-
339
-
340
-
341
-
342
-
343
-
344
-
345
-
346
-
347
-
348
-
349
-
350
-
351
-
352
-
353
-
354
-
355
-
356
-
357
-
358
-
359
-
360
-
361
-
362
-
363
-
364
-
365
-
366
-
367
-
368
-
369
-
370
-
371
-
372
-
373
-
374
-
375
-
376
-
377
-
378
-
379
-
380
-
381
-
382
-
383
-
384
-
385
-
386
 |
 |

Table of Contents
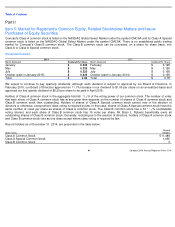
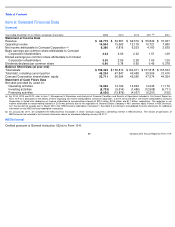
Item 6: Selected Financial Data
Comcast
NBCUniversal
Omitted pursuant to General Instruction I(2)(a) to Form 10-K.
Year ended December 31 (in millions, except per share data)
2014
2013
2012
2011
2010
Statement of Income Data
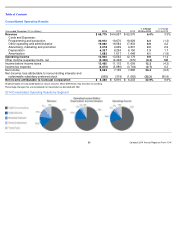
Revenue
$
68,775
$
64,657
$
62,570
$
55,842
$
37,937
Operating income
14,904
13,563
12,179
10,721
7,980
Net income attributable to Comcast Corporation
8,380
6,816
6,203
4,160
3,635
Basic earnings per common share attributable to Comcast
Corporation shareholders
3.24
2.60
2.32
1.51
1.29
Diluted earnings per common share attributable to Comcast
Corporation shareholders
3.20
2.56
2.28
1.50
1.29
Dividends declared per common share
0.90
0.78
0.65
0.45
0.378
Balance Sheet Data (at year end)
Total assets
$
159,339
$
158,813
$
164,971
$
157,818
$
118,534
Total debt, including current portion
48,234
47,847
40,458
39,309
31,415
Comcast Corporation shareholders
’
equity
52,711
50,694
49,356
47,274
44,354
Statement of Cash Flows Data
Net cash provided by (used in):
Operating activities
16,945
14,160
14,854
14,345
11,179
Investing activities
(8,733
)
(9,514
)
(1,486
)
(12,508
)
(5,711
)
Financing activities
(6,020
)
(13,879
)
(4,037
)
(6,201
)
(155
)
(a)
For 2014, 2013 and 2012, refer to Item 7, Management’
s Discussion and Analysis of Financial Condition and Results of Operations included in this Annual Report on
Form 10-
K for a discussion of the effects of items impacting net income attributable to Comcast Corporation. In 2014, 2013 and 2012, net income attributable to Comcast
Corporation is stated after deducting net income attributable to noncontrolling interests of $212 million, $319 million and $1.7 billion, respectively. The reduction in net
income attributable to noncontrolling interests in 2013 was primarily due to the acquisition of General Electric Company’
s 49% common equity interest in NBCUniversal,
LLC that we did not already own in March 2013 (the “NBCUniversal redemption transaction”). See Note 5 to Comcast’
s consolidated financial statements for additional
information on the NBCUniversal redemption transaction.
(b)
On January 28, 2011, we completed the NBCUniversal transaction in which Comcast acquired a controlling interest in NBCUniversal. The results of operations of
NBCUniversal are included in the financial information above for all periods following January 28, 2011.
45
Comcast 2014 Annual Report on Form 10-
K
(b)
(a)