Comcast 2014 Annual Report Download - page 82
Download and view the complete annual report
Please find page 82 of the 2014 Comcast annual report below. You can navigate through the pages in the report by either clicking on the pages listed below, or by using the keyword search tool below to find specific information within the annual report.-
 1
1 -
2
-
3
-
4
-
5
-
6
-
7
-
8
-
9
-
10
-
11
-
12
-
13
-
14
-
15
-
16
-
17
-
18
-
19
-
20
-
21
-
22
-
23
-
24
-
25
-
26
-
27
-
28
-
29
-
30
-
31
-
32
-
33
-
34
-
35
-
36
-
37
-
38
-
39
-
40
-
41
-
42
-
43
-
44
-
45
-
46
-
47
-
48
-
49
-
50
-
51
-
52
-
53
-
54
-
55
-
56
-
57
-
58
-
59
-
60
-
61
-
62
-
63
-
64
-
65
-
66
-
67
-
68
-
69
-
70
-
71
-
 72
72 -
 73
73 -
 74
74 -
 75
75 -
 76
76 -
 77
77 -
 78
78 -
 79
79 -
 80
80 -
 81
81 -
 82
82 -
 83
83 -
 84
84 -
 85
85 -
 86
86 -
 87
87 -
 88
88 -
 89
89 -
 90
90 -
 91
91 -
 92
92 -
93
-
94
-
95
-
96
-
97
-
98
-
99
-
100
-
101
-
102
-
103
-
104
-
105
-
106
-
107
-
108
-
109
-
110
-
111
-
112
-
113
-
114
-
115
-
116
-
117
-
118
-
119
-
120
-
121
-
122
-
123
-
124
-
125
-
126
-
127
-
128
-
129
-
130
-
131
-
132
-
133
-
134
-
135
-
136
-
137
-
138
-
139
-
140
-
141
-
142
-
143
-
144
-
145
-
146
-
147
-
148
-
149
-
150
-
151
-
152
-
153
-
154
-
155
-
156
-
157
-
158
-
159
-
160
-
161
-
162
-
163
-
164
-
165
-
166
-
167
-
168
-
169
-
170
-
171
-
172
-
173
-
174
-
175
-
176
-
177
-
178
-
179
-
180
-
181
-
182
-
183
-
184
-
185
-
186
-
187
-
188
-
189
-
190
-
191
-
192
-
193
-
194
-
195
-
196
-
197
-
198
-
199
-
200
-
201
-
202
-
203
-
204
-
205
-
206
-
207
-
208
-
209
-
210
-
211
-
212
-
213
-
214
-
215
-
216
-
217
-
218
-
219
-
220
-
221
-
222
-
223
-
224
-
225
-
226
-
227
-
228
-
229
-
230
-
231
-
232
-
233
-
234
-
235
-
236
-
237
-
238
-
239
-
240
-
241
-
242
-
243
-
244
-
245
-
246
-
247
-
248
-
249
-
250
-
251
-
252
-
253
-
254
-
255
-
256
-
257
-
258
-
259
-
260
-
261
-
262
-
263
-
264
-
265
-
266
-
267
-
268
-
269
-
270
-
271
-
272
-
273
-
274
-
275
-
276
-
277
-
278
-
279
-
280
-
281
-
282
-
283
-
284
-
285
-
286
-
287
-
288
-
289
-
290
-
291
-
292
-
293
-
294
-
295
-
296
-
297
-
298
-
299
-
300
-
301
-
302
-
303
-
304
-
305
-
306
-
307
-
308
-
309
-
310
-
311
-
312
-
313
-
314
-
315
-
316
-
317
-
318
-
319
-
320
-
321
-
322
-
323
-
324
-
325
-
326
-
327
-
328
-
329
-
330
-
331
-
332
-
333
-
334
-
335
-
336
-
337
-
338
-
339
-
340
-
341
-
342
-
343
-
344
-
345
-
346
-
347
-
348
-
349
-
350
-
351
-
352
-
353
-
354
-
355
-
356
-
357
-
358
-
359
-
360
-
361
-
362
-
363
-
364
-
365
-
366
-
367
-
368
-
369
-
370
-
371
-
372
-
373
-
374
-
375
-
376
-
377
-
378
-
379
-
380
-
381
-
382
-
383
-
384
-
385
-
386
 |
 |

Table of Contents
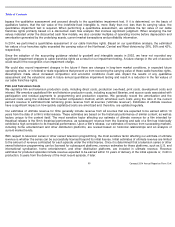
bypass the qualitative assessment and proceed directly to the quantitative impairment test. If it is determined, on the basis of
qualitative factors, that the fair value of the indefinite-
lived intangible is, more likely than not, less than its carrying value, the
quantitative impairment test is required. When performing a quantitative assessment, we estimate the fair value of our cable
franchise rights primarily based on a discounted cash flow analysis that involves significant judgment. When analyzing the fair
values indicated under the discounted cash flow models, we also consider multiples of operating income before depreciation and
amortization generated by the underlying assets, current market transactions and profitability information.
In 2014, we performed a quantitative assessment of our cable franchise rights. Based on our quantitative analysis, the estimated
fair values of our franchise rights exceeded the carrying value of the Northeast, Central and West divisions by 26%, 50% and 42%,
respectively.
Since the adoption of the accounting guidance related to goodwill and intangible assets in 2002, we have not recorded any
significant impairment charges to cable franchise rights as a result of our impairment testing. A future change in the unit of account
could result in the recognition of an impairment charge.
We could also record impairment charges in the future if there are changes in long-
term market conditions, in expected future
operating results, or in federal or state regulations that prevent us from recovering the carrying value of these cable franchise rights.
Assumptions made about increased competition and economic conditions could also impact the results of any qualitative
assessment and the valuations used in future annual quantitative impairment testing and result in a reduction in the fair values of
our cable franchise rights.
Film and Television Costs
We capitalize film and television production costs, including direct costs, production overhead, print costs, development costs and
interest. We amortize capitalized film and television production costs, including acquired libraries, and accrue costs associated with
participation and residual payments to programming and production expense. We generally record the amortization and the
accrued costs using the individual film forecast computation method, which amortizes such costs using the ratio of the current
period’s revenue to estimated total remaining gross revenue from all sources (“ultimate revenue”).
Estimates of ultimate revenue
have a significant impact on how quickly capitalized costs are amortized and, therefore, are updated regularly.
Our estimates of ultimate revenue for films generally include revenue from all sources that are expected to be earned within 10
years from the date of a film’
s initial release. These estimates are based on the historical performance of similar content, as well as
factors unique to the content itself. The most sensitive factor affecting our estimate of ultimate revenue for a film intended for
theatrical release is the film’
s theatrical performance, as subsequent revenue from the licensing and sale of a film has historically
exhibited a high correlation to its theatrical performance. Upon a film’
s release, our estimates of revenue from succeeding markets,
including home entertainment and other distribution platforms, are revised based on historical relationships and an analysis of
current market trends.
With respect to television series or other owned television programming, the most sensitive factor affecting our estimate of ultimate
revenue is whether the series can be successfully licensed beyond its initial license. Initial estimates of ultimate revenue are limited
to the amount of revenue contracted for each episode under the initial license. Once it is determined that a television series or other
owned television programming can be licensed for subsequent platforms, revenue estimates for these platforms, such as U.S. and
international syndication, home entertainment, and other distribution platforms, are included in ultimate revenue. Revenue
estimates for produced episodes include revenue expected to be earned within 10 years of delivery of the initial episode or, if still in
production, 5 years from the delivery of the most recent episode, if later.
77
Comcast 2014 Annual Report on Form 10
-
K