Comcast 2014 Annual Report Download - page 71
Download and view the complete annual report
Please find page 71 of the 2014 Comcast annual report below. You can navigate through the pages in the report by either clicking on the pages listed below, or by using the keyword search tool below to find specific information within the annual report.-
 1
1 -
2
-
3
-
4
-
5
-
6
-
7
-
8
-
9
-
10
-
11
-
12
-
13
-
14
-
15
-
16
-
17
-
18
-
19
-
20
-
21
-
22
-
23
-
24
-
25
-
26
-
27
-
28
-
29
-
30
-
31
-
32
-
33
-
34
-
35
-
36
-
37
-
38
-
39
-
40
-
41
-
42
-
43
-
44
-
45
-
46
-
47
-
48
-
49
-
50
-
51
-
52
-
53
-
54
-
55
-
56
-
57
-
58
-
59
-
60
-
 61
61 -
 62
62 -
 63
63 -
 64
64 -
 65
65 -
 66
66 -
 67
67 -
 68
68 -
 69
69 -
 70
70 -
 71
71 -
 72
72 -
 73
73 -
 74
74 -
 75
75 -
 76
76 -
 77
77 -
 78
78 -
 79
79 -
 80
80 -
 81
81 -
82
-
83
-
84
-
85
-
86
-
87
-
88
-
89
-
90
-
91
-
92
-
93
-
94
-
95
-
96
-
97
-
98
-
99
-
100
-
101
-
102
-
103
-
104
-
105
-
106
-
107
-
108
-
109
-
110
-
111
-
112
-
113
-
114
-
115
-
116
-
117
-
118
-
119
-
120
-
121
-
122
-
123
-
124
-
125
-
126
-
127
-
128
-
129
-
130
-
131
-
132
-
133
-
134
-
135
-
136
-
137
-
138
-
139
-
140
-
141
-
142
-
143
-
144
-
145
-
146
-
147
-
148
-
149
-
150
-
151
-
152
-
153
-
154
-
155
-
156
-
157
-
158
-
159
-
160
-
161
-
162
-
163
-
164
-
165
-
166
-
167
-
168
-
169
-
170
-
171
-
172
-
173
-
174
-
175
-
176
-
177
-
178
-
179
-
180
-
181
-
182
-
183
-
184
-
185
-
186
-
187
-
188
-
189
-
190
-
191
-
192
-
193
-
194
-
195
-
196
-
197
-
198
-
199
-
200
-
201
-
202
-
203
-
204
-
205
-
206
-
207
-
208
-
209
-
210
-
211
-
212
-
213
-
214
-
215
-
216
-
217
-
218
-
219
-
220
-
221
-
222
-
223
-
224
-
225
-
226
-
227
-
228
-
229
-
230
-
231
-
232
-
233
-
234
-
235
-
236
-
237
-
238
-
239
-
240
-
241
-
242
-
243
-
244
-
245
-
246
-
247
-
248
-
249
-
250
-
251
-
252
-
253
-
254
-
255
-
256
-
257
-
258
-
259
-
260
-
261
-
262
-
263
-
264
-
265
-
266
-
267
-
268
-
269
-
270
-
271
-
272
-
273
-
274
-
275
-
276
-
277
-
278
-
279
-
280
-
281
-
282
-
283
-
284
-
285
-
286
-
287
-
288
-
289
-
290
-
291
-
292
-
293
-
294
-
295
-
296
-
297
-
298
-
299
-
300
-
301
-
302
-
303
-
304
-
305
-
306
-
307
-
308
-
309
-
310
-
311
-
312
-
313
-
314
-
315
-
316
-
317
-
318
-
319
-
320
-
321
-
322
-
323
-
324
-
325
-
326
-
327
-
328
-
329
-
330
-
331
-
332
-
333
-
334
-
335
-
336
-
337
-
338
-
339
-
340
-
341
-
342
-
343
-
344
-
345
-
346
-
347
-
348
-
349
-
350
-
351
-
352
-
353
-
354
-
355
-
356
-
357
-
358
-
359
-
360
-
361
-
362
-
363
-
364
-
365
-
366
-
367
-
368
-
369
-
370
-
371
-
372
-
373
-
374
-
375
-
376
-
377
-
378
-
379
-
380
-
381
-
382
-
383
-
384
-
385
-
386
 |
 |

Table of Contents
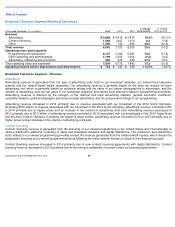
Filmed Entertainment Segment Results of Operations
Filmed Entertainment Segment – Revenue
Theatrical
Theatrical revenue is generated from the worldwide theatrical release of our owned and acquired films for exhibition in movie
theaters and is significantly affected by the timing of each release and the number of films we distribute, as well as their acceptance
by consumers. Theatrical revenue is also affected by the number of exhibition screens, ticket prices, the percentage of ticket sale
retention by the exhibitors and the popularity of competing films at the time our films are released. The success of a film in movie
theaters is a significant factor in determining the revenue a film is likely to generate in succeeding distribution platforms.
Theatrical revenue decreased in 2014 and increased in 2013 primarily due to the strong performance of our major films in 2013,
including Despicable Me 2 and Fast and Furious 6.
The decrease in theatrical revenue in 2014 was partially offset by the
performance of our current year releases, including Lucy and Neighbors .
Content Licensing
Content licensing revenue is generated primarily from the licensing of our owned and acquired films to cable, broadcast and
premium networks, as well as to digital distributors.
Content licensing revenue increased in 2014 primarily due to the timing of availability of content under licensing agreements related
to our film library. Content licensing revenue increased in 2013 primarily due to the international licensing of our 2012 theatrical
releases, as well as from the licensing of our 2013 theatrical releases to digital distributors.
Home Entertainment
Home entertainment revenue is generated from the sale of our owned and acquired films on DVDs to retail stores, rental kiosks and
subscription by mail services, and electronically through digital distributors. Home entertainment revenue is significantly affected by
the timing and number of our releases and their acceptance by consumers. Release dates are determined by several factors,
including the timing of the exhibition of a film in movie theaters, holiday periods and the timing of competitive releases.
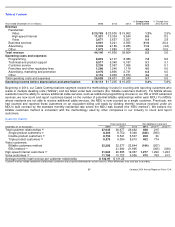
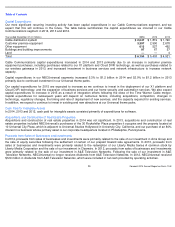
Year ended December 31 (in millions)
2014
2013
2012
% Change
2013 to 2014
% Change
2012 to 2013
Revenue
Theatrical
$
1,101
$
1,568
$
1,390
(29.8
)%
12.8
%
Content licensing
1,792
1,654
1,540
8.3
7.4
Home entertainment
1,457
1,828
1,834
(20.3
)
(0.3
)
Other
658
402
395
63.7
1.8
Total revenue
5,008
5,452
5,159
(8.2
)
5.7
Operating costs and expenses
Programming and production
2,331
2,982
3,002
(21.8
)
(0.7
)
Other operating and administrative
849
716
652
18.5
9.8
Advertising, marketing and promotion
1,117
1,271
1,426
(12.2
)
(10.8
)
Total operating costs and expenses
4,297
4,969
5,080
(13.5
)
(2.2
)
Operating income before depreciation and amortization
$
711
$
483
$
79
47.3
%
509.7
%
Comcast 2014 Annual Report on Form 10
-
K
66