Comcast 2014 Annual Report Download - page 8
Download and view the complete annual report
Please find page 8 of the 2014 Comcast annual report below. You can navigate through the pages in the report by either clicking on the pages listed below, or by using the keyword search tool below to find specific information within the annual report.-
 1
1 -
 2
2 -
 3
3 -
 4
4 -
 5
5 -
 6
6 -
 7
7 -
 8
8 -
 9
9 -
 10
10 -
 11
11 -
 12
12 -
 13
13 -
 14
14 -
 15
15 -
 16
16 -
 17
17 -
 18
18 -
 19
19 -
20
-
21
-
22
-
23
-
24
-
25
-
26
-
27
-
28
-
29
-
30
-
31
-
32
-
33
-
34
-
35
-
36
-
37
-
38
-
39
-
40
-
41
-
42
-
43
-
44
-
45
-
46
-
47
-
48
-
49
-
50
-
51
-
52
-
53
-
54
-
55
-
56
-
57
-
58
-
59
-
60
-
61
-
62
-
63
-
64
-
65
-
66
-
67
-
68
-
69
-
70
-
71
-
72
-
73
-
74
-
75
-
76
-
77
-
78
-
79
-
80
-
81
-
82
-
83
-
84
-
85
-
86
-
87
-
88
-
89
-
90
-
91
-
92
-
93
-
94
-
95
-
96
-
97
-
98
-
99
-
100
-
101
-
102
-
103
-
104
-
105
-
106
-
107
-
108
-
109
-
110
-
111
-
112
-
113
-
114
-
115
-
116
-
117
-
118
-
119
-
120
-
121
-
122
-
123
-
124
-
125
-
126
-
127
-
128
-
129
-
130
-
131
-
132
-
133
-
134
-
135
-
136
-
137
-
138
-
139
-
140
-
141
-
142
-
143
-
144
-
145
-
146
-
147
-
148
-
149
-
150
-
151
-
152
-
153
-
154
-
155
-
156
-
157
-
158
-
159
-
160
-
161
-
162
-
163
-
164
-
165
-
166
-
167
-
168
-
169
-
170
-
171
-
172
-
173
-
174
-
175
-
176
-
177
-
178
-
179
-
180
-
181
-
182
-
183
-
184
-
185
-
186
-
187
-
188
-
189
-
190
-
191
-
192
-
193
-
194
-
195
-
196
-
197
-
198
-
199
-
200
-
201
-
202
-
203
-
204
-
205
-
206
-
207
-
208
-
209
-
210
-
211
-
212
-
213
-
214
-
215
-
216
-
217
-
218
-
219
-
220
-
221
-
222
-
223
-
224
-
225
-
226
-
227
-
228
-
229
-
230
-
231
-
232
-
233
-
234
-
235
-
236
-
237
-
238
-
239
-
240
-
241
-
242
-
243
-
244
-
245
-
246
-
247
-
248
-
249
-
250
-
251
-
252
-
253
-
254
-
255
-
256
-
257
-
258
-
259
-
260
-
261
-
262
-
263
-
264
-
265
-
266
-
267
-
268
-
269
-
270
-
271
-
272
-
273
-
274
-
275
-
276
-
277
-
278
-
279
-
280
-
281
-
282
-
283
-
284
-
285
-
286
-
287
-
288
-
289
-
290
-
291
-
292
-
293
-
294
-
295
-
296
-
297
-
298
-
299
-
300
-
301
-
302
-
303
-
304
-
305
-
306
-
307
-
308
-
309
-
310
-
311
-
312
-
313
-
314
-
315
-
316
-
317
-
318
-
319
-
320
-
321
-
322
-
323
-
324
-
325
-
326
-
327
-
328
-
329
-
330
-
331
-
332
-
333
-
334
-
335
-
336
-
337
-
338
-
339
-
340
-
341
-
342
-
343
-
344
-
345
-
346
-
347
-
348
-
349
-
350
-
351
-
352
-
353
-
354
-
355
-
356
-
357
-
358
-
359
-
360
-
361
-
362
-
363
-
364
-
365
-
366
-
367
-
368
-
369
-
370
-
371
-
372
-
373
-
374
-
375
-
376
-
377
-
378
-
379
-
380
-
381
-
382
-
383
-
384
-
385
-
386
 |
 |

Table of Contents
Description of Our Businesses
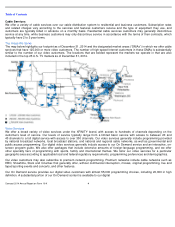
Cable Communications Segment
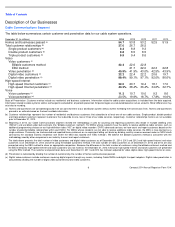
The table below summarizes certain customer and penetration data for our cable system operations.
Basis of Presentation: Customer metrics include our residential and business customers. Information related to cable system acquisitions is included from the date acquired.
Information related to cable systems sold or exchanged is excluded for all periods presented. All percentages are calculated based on actual amounts. Minor differences may
exist due to rounding.
The table above presents the total number of video customers and digital video customers as of December 31, 2014, 2013 and 2012 and high-
speed Internet and voice
customers as of December 31, 2014 and 2013 using the billable customers method. The total number of video customers as of December 31, 2013 and 2012 are also
presented using the EBU method to show an appropriate comparison. Because the difference in the total number of customers using the billable customers method and
the EBU method for high-speed Internet and voice customers was not material, the December 31, 2012 metrics for high-
speed Internet and voice customers are presented
using the EBU method. The customer and penetration data as of December 31, 2011 and 2010 has not been adjusted for video, digital video, high-
speed Internet or voice.
December 31 (in millions)
2014
2013
2012
2011
2010
Homes and businesses passed
54.7
53.8
53.2
52.5
51.9
Total customer relationships
27.0
26.7
26.5
Single product customers
8.4
8.8
9.3
Double product customers
8.8
8.5
8.5
Triple product customers
9.9
9.4
8.6
Video
Video customers
Billable customers method
22.4
22.6
22.8
EBU method
21.7
22.0
22.3
22.8
Video penetration
40.9
%
41.9
%
43.0
%
42.5
%
43.9
%
Digital video customers
22.2
22.4
22.2
20.6
19.7
Digital video penetration
99.4
%
99.1
%
97.1
%
92.0
%
86.6
%
High-speed Internet
High-speed Internet customers
22.0
20.7
19.4
18.1
17.0
High-speed Internet penetration
40.2
%
38.4
%
36.4
%
34.6
%
32.7
%
Voice
Voice customers
11.2
10.7
10.0
9.3
8.6
Voice penetration
20.5
%
19.9
%
18.7
%
17.8
%
16.6
%
(a)
Homes and businesses are considered passed if we can connect them to our distribution system without further extending the transmission lines. Homes and businesses
passed is an estimate based on the best available information.
(b)
Customer relationships represent the number of residential and business customers that subscribe to at least one of our cable services. Single product, double product
and triple product customers represent customers that subscribe to one, two or three of our cable services, respectively. Customer relationship metrics are not available
prior to December 31, 2012.
(c)
Beginning in 2014, our Cable Communications segment revised the methodology it uses for counting and reporting customers who reside in multiple dwelling units
(“MDUs”) and are billed under bulk contracts (the “billable customers method”).
For MDUs whose residents have the ability to receive additional cable services, such as
additional programming choices or our high-definition video (“HD”) or digital video recorder (“DVR”)
advanced services, we now count and report customers based on the
number of potential billable relationships within each MDU. For MDUs whose residents are not able to receive additional cable services, the MDU is now counted as a
single customer. Previously, we had counted and reported these customers on an equivalent billing unit basis by dividing monthly revenue received under an MDU’
s bulk
contract by the standard monthly residential rate where the MDU was located (the “EBU method”).
We believe the billable customers method is consistent with the
methodology used by other companies in our industry to count and report customers.
(d)
Penetration is calculated by dividing the number of customers by the number of homes and businesses passed.
(e)
Digital video customers include customers receiving digital signals through any means, including CableCARDs and digital transport adapters. Digital video penetration is
calculated by dividing the number of digital video customers by total video customers.
3
Comcast 2014 Annual Report on Form 10
-
K
(a)
(b)
(b)
(b)
(b)
(c)
(d)
(e)
(e)
(c)
(d)
(c)
(d)