Comcast 2014 Annual Report Download - page 179
Download and view the complete annual report
Please find page 179 of the 2014 Comcast annual report below. You can navigate through the pages in the report by either clicking on the pages listed below, or by using the keyword search tool below to find specific information within the annual report.-
 1
1 -
2
-
3
-
4
-
5
-
6
-
7
-
8
-
9
-
10
-
11
-
12
-
13
-
14
-
15
-
16
-
17
-
18
-
19
-
20
-
21
-
22
-
23
-
24
-
25
-
26
-
27
-
28
-
29
-
30
-
31
-
32
-
33
-
34
-
35
-
36
-
37
-
38
-
39
-
40
-
41
-
42
-
43
-
44
-
45
-
46
-
47
-
48
-
49
-
50
-
51
-
52
-
53
-
54
-
55
-
56
-
57
-
58
-
59
-
60
-
61
-
62
-
63
-
64
-
65
-
66
-
67
-
68
-
69
-
70
-
71
-
72
-
73
-
74
-
75
-
76
-
77
-
78
-
79
-
80
-
81
-
82
-
83
-
84
-
85
-
86
-
87
-
88
-
89
-
90
-
91
-
92
-
93
-
94
-
95
-
96
-
97
-
98
-
99
-
100
-
101
-
102
-
103
-
104
-
105
-
106
-
107
-
108
-
109
-
110
-
111
-
112
-
113
-
114
-
115
-
116
-
117
-
118
-
119
-
120
-
121
-
122
-
123
-
124
-
125
-
126
-
127
-
128
-
129
-
130
-
131
-
132
-
133
-
134
-
135
-
136
-
137
-
138
-
139
-
140
-
141
-
142
-
143
-
144
-
145
-
146
-
147
-
148
-
149
-
150
-
151
-
152
-
153
-
154
-
155
-
156
-
157
-
158
-
159
-
160
-
161
-
162
-
163
-
164
-
165
-
166
-
167
-
168
-
 169
169 -
 170
170 -
 171
171 -
 172
172 -
 173
173 -
 174
174 -
 175
175 -
 176
176 -
 177
177 -
 178
178 -
 179
179 -
 180
180 -
 181
181 -
 182
182 -
 183
183 -
 184
184 -
 185
185 -
 186
186 -
 187
187 -
 188
188 -
 189
189 -
190
-
191
-
192
-
193
-
194
-
195
-
196
-
197
-
198
-
199
-
200
-
201
-
202
-
203
-
204
-
205
-
206
-
207
-
208
-
209
-
210
-
211
-
212
-
213
-
214
-
215
-
216
-
217
-
218
-
219
-
220
-
221
-
222
-
223
-
224
-
225
-
226
-
227
-
228
-
229
-
230
-
231
-
232
-
233
-
234
-
235
-
236
-
237
-
238
-
239
-
240
-
241
-
242
-
243
-
244
-
245
-
246
-
247
-
248
-
249
-
250
-
251
-
252
-
253
-
254
-
255
-
256
-
257
-
258
-
259
-
260
-
261
-
262
-
263
-
264
-
265
-
266
-
267
-
268
-
269
-
270
-
271
-
272
-
273
-
274
-
275
-
276
-
277
-
278
-
279
-
280
-
281
-
282
-
283
-
284
-
285
-
286
-
287
-
288
-
289
-
290
-
291
-
292
-
293
-
294
-
295
-
296
-
297
-
298
-
299
-
300
-
301
-
302
-
303
-
304
-
305
-
306
-
307
-
308
-
309
-
310
-
311
-
312
-
313
-
314
-
315
-
316
-
317
-
318
-
319
-
320
-
321
-
322
-
323
-
324
-
325
-
326
-
327
-
328
-
329
-
330
-
331
-
332
-
333
-
334
-
335
-
336
-
337
-
338
-
339
-
340
-
341
-
342
-
343
-
344
-
345
-
346
-
347
-
348
-
349
-
350
-
351
-
352
-
353
-
354
-
355
-
356
-
357
-
358
-
359
-
360
-
361
-
362
-
363
-
364
-
365
-
366
-
367
-
368
-
369
-
370
-
371
-
372
-
373
-
374
-
375
-
376
-
377
-
378
-
379
-
380
-
381
-
382
-
383
-
384
-
385
-
386
 |
 |

Table of Contents
NBCUniversal Media, LLC
(in millions)
Revenue
Operating
Income (Loss)
Before
Depreciation
and
Amortization
Depreciation
and
Amortization
Operating
Income
(Loss)
Capital
Expenditures
Assets
2013
Cable Networks
$
9,201
$
3,501
$
734
$
2,767
$
67
$
29,413
Broadcast Television
7,120
345
98
247
65
6,723
Filmed Entertainment
5,452
483
15
468
9
3,549
Theme Parks
2,235
1,004
300
704
580
6,608
Headquarters and Other
31
(588
)
264
(852
)
439
6,002
Eliminations
(389
)
(13
)
—
(
13
)
—
(
556
)
Total
$
23,650
$
4,732
$
1,411
$
3,321
$
1,160
$
51,739
(in millions)
Revenue
Operating
Income (Loss)
Before
Depreciation
and
Amortization
Depreciation
and
Amortization
Operating Income
(Loss)
Capital
Expenditures
2012
Cable Networks
$
8,727
$
3,303
$
735
$
2,568
$
150
Broadcast Television
8,200
358
97
261
65
Filmed Entertainment
5,159
79
16
63
7
Theme Parks
2,085
953
268
685
272
Headquarters and Other
43
(603
)
210
(813
)
269
Eliminations
(402
)
17
—
17
—
Total
$
23,812
$
4,107
$
1,326
$
2,781
$
763
(a)
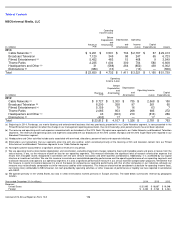
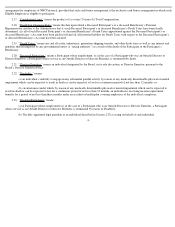
Beginning in 2014, Fandango, our movie ticketing and entertainment business that was previously presented in our Cable Networks segment, is now presented in the
Filmed Entertainment segment to reflect the change in our management reporting presentation. Due to immateriality, prior period amounts have not been adjusted.
(b)
The revenue and operating costs and expenses associated with our broadcast of the 2014 Sochi Olympics were reported in our Cable Networks and Broadcast Television
segments. The revenue and operating costs and expenses associated with our broadcasts of the 2012 London Olympics and the 2012 Super Bowl were reported in our
Broadcast Television segment.
(c)
Headquarters and Other activities include costs associated with overhead, allocations, personnel costs and corporate initiatives.
(d)
Eliminations are transactions that our segments enter into with one another, which consisted primarily of the licensing of film and television content from our Filmed
Entertainment and Broadcast Television segments to our Cable Networks segment.
(e)
No single customer accounted for a significant amount of revenue in any period.
(f)
We use operating income (loss) before depreciation and amortization, excluding impairment charges related to fixed and intangible assets and gains or losses from the
sale of assets, if any, as the measure of profit or loss for our operating segments. This measure eliminates the significant level of noncash amortization expense that
results from intangible assets recognized in connection with the joint venture transaction and other business combinations. Additionally, it is unaffected by our capital
structure or investment activities. We use this measure to evaluate our consolidated operating performance and the operating performance of our operating segments and
to allocate resources and capital to our operating segments. It is also a significant performance measure in our annual incentive compensation programs. We believe that
this measure is useful to investors because it is one of the bases for comparing our operating performance with that of other companies in our industries, although our
measure may not be directly comparable to similar measures used by other companies. This measure should not be considered a substitute for operating income (loss),
net income (loss) attributable to NBCUniversal, net cash provided by operating activities, or other measures of performance or liquidity we have reported in accordance
with GAAP.
(g)
We operate primarily in the United States, but also in select international markets primarily in Europe and Asia. The table below summarizes revenue by geographic
location.
Year ended December 31 (in millions)
2014
2013
2012
Revenue:
United States
$
20,995
$
18,887
$
19,348
Foreign
$
4,433
$
4,763
$
4,464
Comcast 2014 Annual Report on Form 10-K
174
(e)(g)
(f)
(a)
(a)
(c)
(d)
(e)(g)
(f)
(a)
(b)
(a)
(c)
(d)