Comcast 2014 Annual Report Download - page 68
Download and view the complete annual report
Please find page 68 of the 2014 Comcast annual report below. You can navigate through the pages in the report by either clicking on the pages listed below, or by using the keyword search tool below to find specific information within the annual report.-
 1
1 -
2
-
3
-
4
-
5
-
6
-
7
-
8
-
9
-
10
-
11
-
12
-
13
-
14
-
15
-
16
-
17
-
18
-
19
-
20
-
21
-
22
-
23
-
24
-
25
-
26
-
27
-
28
-
29
-
30
-
31
-
32
-
33
-
34
-
35
-
36
-
37
-
38
-
39
-
40
-
41
-
42
-
43
-
44
-
45
-
46
-
47
-
48
-
49
-
50
-
51
-
52
-
53
-
54
-
55
-
56
-
57
-
 58
58 -
 59
59 -
 60
60 -
 61
61 -
 62
62 -
 63
63 -
 64
64 -
 65
65 -
 66
66 -
 67
67 -
 68
68 -
 69
69 -
 70
70 -
 71
71 -
 72
72 -
 73
73 -
 74
74 -
 75
75 -
 76
76 -
 77
77 -
 78
78 -
79
-
80
-
81
-
82
-
83
-
84
-
85
-
86
-
87
-
88
-
89
-
90
-
91
-
92
-
93
-
94
-
95
-
96
-
97
-
98
-
99
-
100
-
101
-
102
-
103
-
104
-
105
-
106
-
107
-
108
-
109
-
110
-
111
-
112
-
113
-
114
-
115
-
116
-
117
-
118
-
119
-
120
-
121
-
122
-
123
-
124
-
125
-
126
-
127
-
128
-
129
-
130
-
131
-
132
-
133
-
134
-
135
-
136
-
137
-
138
-
139
-
140
-
141
-
142
-
143
-
144
-
145
-
146
-
147
-
148
-
149
-
150
-
151
-
152
-
153
-
154
-
155
-
156
-
157
-
158
-
159
-
160
-
161
-
162
-
163
-
164
-
165
-
166
-
167
-
168
-
169
-
170
-
171
-
172
-
173
-
174
-
175
-
176
-
177
-
178
-
179
-
180
-
181
-
182
-
183
-
184
-
185
-
186
-
187
-
188
-
189
-
190
-
191
-
192
-
193
-
194
-
195
-
196
-
197
-
198
-
199
-
200
-
201
-
202
-
203
-
204
-
205
-
206
-
207
-
208
-
209
-
210
-
211
-
212
-
213
-
214
-
215
-
216
-
217
-
218
-
219
-
220
-
221
-
222
-
223
-
224
-
225
-
226
-
227
-
228
-
229
-
230
-
231
-
232
-
233
-
234
-
235
-
236
-
237
-
238
-
239
-
240
-
241
-
242
-
243
-
244
-
245
-
246
-
247
-
248
-
249
-
250
-
251
-
252
-
253
-
254
-
255
-
256
-
257
-
258
-
259
-
260
-
261
-
262
-
263
-
264
-
265
-
266
-
267
-
268
-
269
-
270
-
271
-
272
-
273
-
274
-
275
-
276
-
277
-
278
-
279
-
280
-
281
-
282
-
283
-
284
-
285
-
286
-
287
-
288
-
289
-
290
-
291
-
292
-
293
-
294
-
295
-
296
-
297
-
298
-
299
-
300
-
301
-
302
-
303
-
304
-
305
-
306
-
307
-
308
-
309
-
310
-
311
-
312
-
313
-
314
-
315
-
316
-
317
-
318
-
319
-
320
-
321
-
322
-
323
-
324
-
325
-
326
-
327
-
328
-
329
-
330
-
331
-
332
-
333
-
334
-
335
-
336
-
337
-
338
-
339
-
340
-
341
-
342
-
343
-
344
-
345
-
346
-
347
-
348
-
349
-
350
-
351
-
352
-
353
-
354
-
355
-
356
-
357
-
358
-
359
-
360
-
361
-
362
-
363
-
364
-
365
-
366
-
367
-
368
-
369
-
370
-
371
-
372
-
373
-
374
-
375
-
376
-
377
-
378
-
379
-
380
-
381
-
382
-
383
-
384
-
385
-
386
 |
 |

Table of Contents
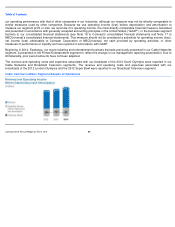
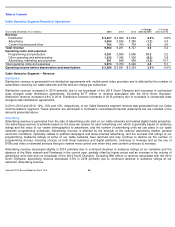
increased 4.3% in 2013 primarily due to higher prices and an increase in the volume of advertising units sold, which contributed to a
combined increase of 8.9%. The increase in advertising revenue in 2013 was partially offset by continued declines in audience
ratings at our networks.
Content Licensing and Other
We also generate other revenue primarily from the licensing of our owned programming in the United States and internationally to
various distribution platforms, including cable and broadcast networks and digital distributors.
Content licensing and other revenue remained flat in 2014. Content licensing and other revenue increased in 2013 primarily due to
the timing of availability of content under our licensing agreements with digital distributors.
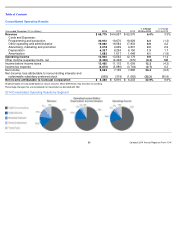
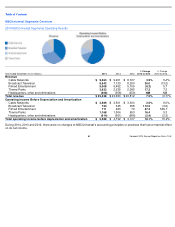
Cable Networks Segment – Operating Costs and Expenses
Programming and Production Costs
Programming and production costs include the amortization of owned and acquired programming, sports rights, direct production
costs, residual and participation payments, production overhead, costs associated with the distribution of our programming to third-
party networks and other distribution platforms, and on-air talent costs.
Programming and production costs increased in 2014 primarily due to costs of $242 million associated with the 2014 Sochi
Olympics, as well as our continued investment in programming, including original programming at our entertainment networks and
sports programming rights costs. The increase in sports programming rights costs in 2014 included the impact of a new rights
agreement with a professional sports team and the full year of English Premier League soccer. Programming and production costs
increased in 2013 primarily due to our continued investment in programming, including sports programming rights costs. The
increase in sports programming rights costs in 2013 included the impact from an increase in the number of NHL games compared
to 2012 due to the NHL lockout in 2012, as well as costs associated with our broadcasts of English Premier League soccer, which
began in August 2013.
Other Operating and Administrative Costs and Expenses
Other operating and administrative costs and expenses include salaries, employee benefits, rent and other overhead expenses.
Other operating and administrative costs and expenses decreased in 2014 primarily due to lower employee-
related costs and the
absence of the Style network and Fandango in the current year. Other operating and administrative costs and expenses increased
in 2013 primarily due to an increase in employee-related costs.
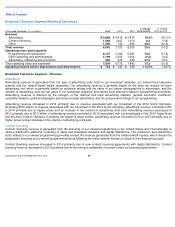
Advertising, Marketing and Promotion Expenses
Advertising, marketing and promotion expenses consist primarily of the costs associated with promoting our cable networks and
costs associated with our related digital media properties.
Advertising, marketing and promotion expenses remained relatively flat in 2014. Advertising, marketing and promotion expenses
increased in 2013 primarily due to increased spending on marketing related to the launch of new programming on our cable
networks.
63
Comcast 2014 Annual Report on Form 10-
K