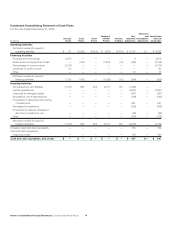
Comcast 2006 Annual Report Download - page 79
Download and view the complete annual report
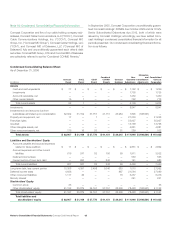
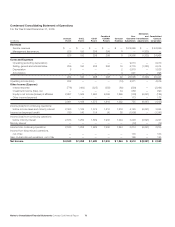
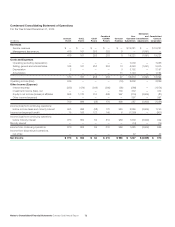
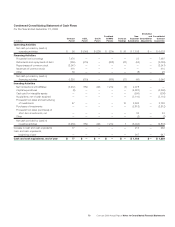
Please find page 79 of the 2006 Comcast annual report below. You can navigate through the pages in the report by either clicking on the pages listed below, or by using the keyword search tool below to find specific information within the annual report.-
 1
1 -
2
-
3
-
4
-
5
-
6
-
7
-
8
-
9
-
10
-
11
-
12
-
13
-
14
-
15
-
16
-
17
-
18
-
19
-
20
-
21
-
22
-
23
-
24
-
25
-
26
-
27
-
28
-
29
-
30
-
31
-
32
-
33
-
34
-
35
-
36
-
37
-
38
-
39
-
40
-
41
-
42
-
43
-
44
-
45
-
46
-
47
-
48
-
49
-
50
-
51
-
52
-
53
-
54
-
55
-
56
-
57
-
58
-
59
-
60
-
61
-
62
-
63
-
64
-
65
-
66
-
67
-
68
-
 69
69 -
 70
70 -
 71
71 -
 72
72 -
 73
73 -
 74
74 -
 75
75 -
 76
76 -
 77
77 -
 78
78 -
 79
79 -
 80
80 -
 81
81 -
 82
82 -
 83
83 -
 84
84
 |
 |
77 Comcast 2006 Annual Report
Our Class A common stock is listed on the Nasdaq Global Select
Market under the symbol CMCSA and our Class A Special com-
mon stock is listed on the Nasdaq Global Select Market under the
symbol CMCSK. There is no established public trading market for
our Class B common stock. Our Class B common stock can be
converted, on a share for share basis, into Class A or Class A Spe-
cial common stock. The following table sets forth, for the indicated
periods, the high and low sales prices of our Class A and Class A
Special common stock (adjusted to reflect the Stock Split).
Class A Class A Special
High Low High Low
2006
First Quarter $ 18.97 $ 16.90 $ 18.87 $ 16.73
Second Quarter 22.37 17.45 22.27 17.33
Third Quarter 24.77 20.67 24.74 20.64
Fourth Quarter 28.94 24.17 28.69 24.14
2005
First Quarter $ 23.00 $ 20.69 $ 22.77 $ 20.33
Second Quarter 22.69 20.37 22.47 19.80
Third Quarter 21.54 19.16 21.25 18.82
Fourth Quarter 19.56 17.20 19.24 17.01
We have not declared and paid any cash dividends on our Class
A, Class A Special or Class B common stock in our last two fiscal
years and do not intend to do so for the foreseeable future.
As of December 31, 2006, there were 921,275 record holders of
our Class A common stock, 2,266 record holders of our Class A
Special common stock and three record holders of our Class B
common stock.
Market for the Registrant’s Common Equity
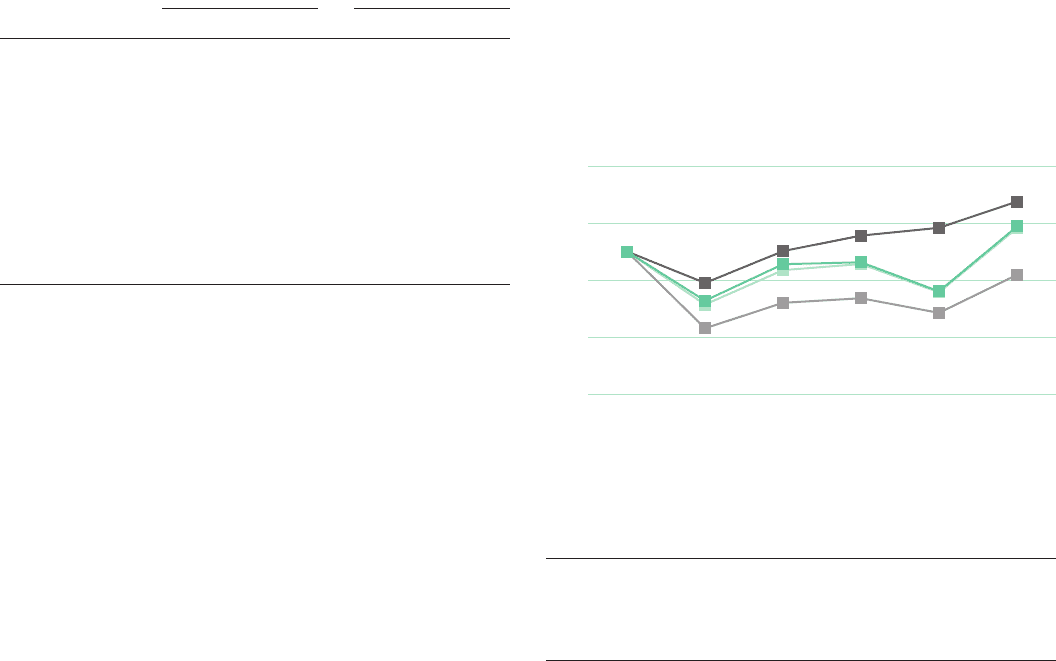
Stock Performance Graph
The following graph compares the yearly percentage change in
the cumulative total shareholder return on our Class A common
stock and Class A Special common stock during the five years
ended December 31, 2006, with the cumulative total return on the
Standard & Poor’s 500 Stock Index and with a selected peer group
consisting of us and other companies engaged in the cable, tele-
communications and media industries. This peer group consists
of Cablevision Systems Corporation (Class A), Time Warner Inc.,
The DirecTV Group Inc. and Echostar Communications Corp. The
comparison assumes $100 was invested on December 31, 2001,
in our Class A common stock and Class A Special common stock
and in each of the following indices and assumes the reinvestment
of dividends.
COMPARISON OF 5 YEAR CUMULATIVE TOTAL RETURN
Among Comcast Corporation, the S&P 500 Index and a Peer Group
$0
$20
$40
$60
$80
$100
$120
$140
$160
12/0612/0512/0412/0312/0212/01
Comcast Class A
Comcast Class A Special
S&P 500
Peer Group
(in dollars) 2002 2003 2004 2005 2006
Comcast Class A 65 91 92 72 118
Comcast Class A Special 63 87 91 71 116
S&P 500 Stock Index 78 100 111 117 135
Peer Group Index 46 64 67 57 84
■
■
■
■