Comcast 2006 Annual Report Download - page 41
Download and view the complete annual report
Please find page 41 of the 2006 Comcast annual report below. You can navigate through the pages in the report by either clicking on the pages listed below, or by using the keyword search tool below to find specific information within the annual report.-
 1
1 -
2
-
3
-
4
-
5
-
6
-
7
-
8
-
9
-
10
-
11
-
12
-
13
-
14
-
15
-
16
-
17
-
18
-
19
-
20
-
21
-
22
-
23
-
24
-
25
-
26
-
27
-
28
-
29
-
30
-
 31
31 -
 32
32 -
 33
33 -
 34
34 -
 35
35 -
 36
36 -
 37
37 -
 38
38 -
 39
39 -
 40
40 -
 41
41 -
 42
42 -
 43
43 -
 44
44 -
 45
45 -
 46
46 -
 47
47 -
 48
48 -
 49
49 -
 50
50 -
 51
51 -
52
-
53
-
54
-
55
-
56
-
57
-
58
-
59
-
60
-
61
-
62
-
63
-
64
-
65
-
66
-
67
-
68
-
69
-
70
-
71
-
72
-
73
-
74
-
75
-
76
-
77
-
78
-
79
-
80
-
81
-
82
-
83
-
84
 |
 |

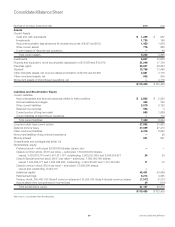
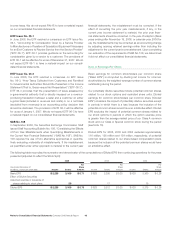
39 Comcast 2006 Annual Report
December 31 (in millions, except share data) 2006 2005
Assets
Current Assets
Cash and cash equivalents $ 1,239 $ 947
Investments 1,735 148
Accounts receivable, less allowance for doubtful accounts of $157 and $132 1,450 1,008
Other current assets 778 685
Current assets of discontinued operations — 60
Total current assets 5,202 2,848
Investments 8,847 12,675
Property and equipment, net of accumulated depreciation of $15,506 and $12,079 21,248 17,704
Franchise rights 55,927 48,804
Goodwill 13,768 13,498
Other intangible assets, net of accumulated amortization of $5,543 and $4,635 4,881 3,118
Other noncurrent assets, net 532 635
Noncurrent assets of discontinued operations, net — 4,118
$ 110,405 $ 103,400
Liabilities and Stockholders’ Equity
Current Liabilities
Accounts payable and accrued expenses related to trade creditors $ 2,862 $ 2,239
Accrued salaries and wages 453 360
Other current liabilities 2,579 2,122
Deferred income taxes 563 2
Current portion of long-term debt 983 1,689
Current liabilities of discontinued operations — 112
Total current liabilities 7,440 6,524
Long-term debt, less current portion 27,992 21,682
Deferred income taxes 27,089 27,370
Other noncurrent liabilities 6,476 6,920
Noncurrent liabilities of discontinued operations — 28
Minority interest 241 657
Commitments and contingencies (Note 13)
Stockholders’ equity
Preferred stock — authorized 20,000,000 shares; issued, zero — —
Class A common stock, $0.01 par value — authorized, 7,500,000,000 shares;
issued, 2,425,818,710 and 2,410,511,727; outstanding, 2,060,357,960, and 2,045,050,977 24 24
Class A Special common stock, $0.01 par value — authorized, 7,500,000,000 shares;
issued 1,120,659,771 and 1,224,368,823; outstanding, 1,049,725,007 and 1,153,434,059 11 12
Class B common stock, $0.01 par value — authorized, 75,000,000 shares;
issued and outstanding, 9,444,375 — —
Additional capital 42,401 42,989
Retained earnings 6,214 4,825
Treasury stock, 365,460,750 Class A common shares and 70,934,764 Class A Special common shares (7,517) (7,517)
Accumulated other comprehensive income (loss) 34 (114)
Total stockholders’ equity 41,167 40,219
$ 110,405 $ 103,400
See notes to consolidated financial statements.
Consolidated Balance Sheet