Comcast 2006 Annual Report Download - page 78
Download and view the complete annual report
Please find page 78 of the 2006 Comcast annual report below. You can navigate through the pages in the report by either clicking on the pages listed below, or by using the keyword search tool below to find specific information within the annual report.-
 1
1 -
2
-
3
-
4
-
5
-
6
-
7
-
8
-
9
-
10
-
11
-
12
-
13
-
14
-
15
-
16
-
17
-
18
-
19
-
20
-
21
-
22
-
23
-
24
-
25
-
26
-
27
-
28
-
29
-
30
-
31
-
32
-
33
-
34
-
35
-
36
-
37
-
38
-
39
-
40
-
41
-
42
-
43
-
44
-
45
-
46
-
47
-
48
-
49
-
50
-
51
-
52
-
53
-
54
-
55
-
56
-
57
-
58
-
59
-
60
-
61
-
62
-
63
-
64
-
65
-
66
-
67
-
 68
68 -
 69
69 -
 70
70 -
 71
71 -
 72
72 -
 73
73 -
 74
74 -
 75
75 -
 76
76 -
 77
77 -
 78
78 -
 79
79 -
 80
80 -
 81
81 -
 82
82 -
 83
83 -
 84
84
 |
 |

Comcast 2006 Annual Report 76
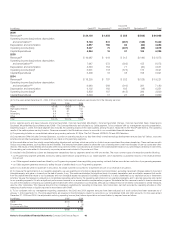
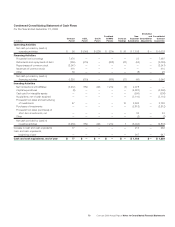
Reconciliation of 2006 Operating Income to
Operating Cash Flow
(in millions)
Operating Income $ 4,619
Depreciation and Amortization 4,823
Operating Cash Flow(a) $ 9,442
(a) Operating Cash Flow (as presented above) is defined as operating income before
depreciation and amortization, excluding impairment charges related to fixed and
intangible assets and gains or losses on sale of assets, if any.
Calculation of 2006 Free Cash Flow
(in millions)
Net Cash Provided by Operating Activities $ 6,618
Capital Expenditures (4,395)
Cash Paid For Intangible Assets (306)
Nonoperating Items, Net of Tax 706
Free Cash Flow(a) $ 2,623
(a) Free Cash Flow (as presented above) is defined as “Net Cash Provided by Operating
Activities” (as stated in our Consolidated Statement of Cash Flows) reduced by capital
expenditures and cash paid for intangible assets; and increased by any payments
related to certain nonoperating items, net of estimated tax benefits (such as income
taxes on investment sales, and nonrecurring payments related to income tax and
litigation contingencies of acquired companies).
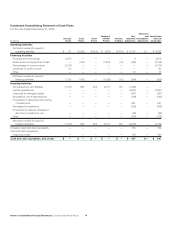
Reconciliation of Non-GAAP Measures
Reconciliation of Cable Segment Pro Forma, “As Adjusted” Financial Data
Pro Forma Cable Pro Forma
(in millions) Cable Adjustments(a) Pro Forma % Growth % Growth
2006
Revenue $ 24,100 $ 2,239 $ 26,339 12% 21%
Operating Expenses (excluding depreciation
and amortization) 14,396 1,432 15,828
Operating Cash Flow $ 9,704 $ 807 $ 10,511 15% 22%
Depreciation and Amortization 4,657 608 5,265
Operating Income $ 5,047 $ 199 $ 5,246
2005
Revenue $ 19,987 $ 3,569 $ 23,556
Operating Expenses (excluding depreciation
and amortization) 11,924 2,384 14,308
Stock option adjustment(b) 116 — 116
Operating Cash Flow $ 7,947 $ 1,185 $ 9,132
Depreciation and Amortization 4,346 1,134 5,480
Operating Income $ 3,601 $ 51 $ 3,652
(a) Pro forma results adjust only for certain acquisitions and dispositions, including Susquehanna Communications (April 2006), the Adelphia and Time Warner transactions
(July 2006) and the dissolution of the Texas and Kansas City cable partnership (effective January 1, 2007). Cable segment results are presented as if the transactions noted above
were effective on January 1, 2005.
(b) To be consistent with our management reporting, the 2005 Cable segment amounts have been adjusted as if stock options had been expensed as of January 1, 2005.