Comcast 2006 Annual Report Download - page 28
Download and view the complete annual report
Please find page 28 of the 2006 Comcast annual report below. You can navigate through the pages in the report by either clicking on the pages listed below, or by using the keyword search tool below to find specific information within the annual report.-
 1
1 -
2
-
3
-
4
-
5
-
6
-
7
-
8
-
9
-
10
-
11
-
12
-
13
-
14
-
15
-
16
-
17
-
 18
18 -
 19
19 -
 20
20 -
 21
21 -
 22
22 -
 23
23 -
 24
24 -
 25
25 -
 26
26 -
 27
27 -
 28
28 -
 29
29 -
 30
30 -
 31
31 -
 32
32 -
 33
33 -
 34
34 -
 35
35 -
 36
36 -
 37
37 -
 38
38 -
39
-
40
-
41
-
42
-
43
-
44
-
45
-
46
-
47
-
48
-
49
-
50
-
51
-
52
-
53
-
54
-
55
-
56
-
57
-
58
-
59
-
60
-
61
-
62
-
63
-
64
-
65
-
66
-
67
-
68
-
69
-
70
-
71
-
72
-
73
-
74
-
75
-
76
-
77
-
78
-
79
-
80
-
81
-
82
-
83
-
84
 |
 |
MD&A Comcast 2006 Annual Report 26
The following provides further details of our highlights and insights into our consolidated financial statements, including discussion of our
results of operations and our liquidity and capital resources. As a result of transferring our previously owned cable systems located in Los
Angeles, Cleveland and Dallas (“Comcast Exchange Systems”), the operating results of the Comcast Exchange Systems are reported as
discontinued operations for all periods presented.
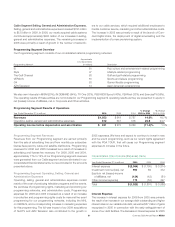
Consolidated Operating Results
% Change % Change
Year Ended December 31 (in millions) 2006 2005 2004 2005 to 2006 2004 to 2005
Revenues $ 24,966 $ 21,075 $ 19,221 18.5% 9.6%
Costs and Expenses
Operating, Selling, General and Administrative (excluding depreciation) 15,524 13,003 12,041 19.4 8.0
Depreciation 3,828 3,413 3,197 12.2 6.8
Amortization 995 1,138 1,154 (12.5) (1.5)
Operating Income 4,619 3,521 2,829 31.2 24.4
Other Income (Expense) Items, net (1,025) (1,801) (1,086) (43.1) 65.8
Income from Continuing Operations before Income Taxes and
Minority Interest 3,594 1,720 1,743 109.0 (1.4)
Income Tax Expense (1,347) (873) (801) 54.3 9.0
Income from Continuing Operations before Minority Interest 2,247 847 942 165.5 (10.2)
Minority Interest (12) (19) (14) (36.8) 35.7
Income from Continuing Operations 2,235 828 928 169.9 (10.8)
Discontinued Operations, net of Tax 298 100 42 198.0 138.1
Net Income $ 2,533 $ 928 $ 970 173.0% (4.3)%
All percentages are calculated based on actual amounts. Minor differences may exist due to rounding.
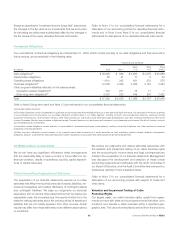
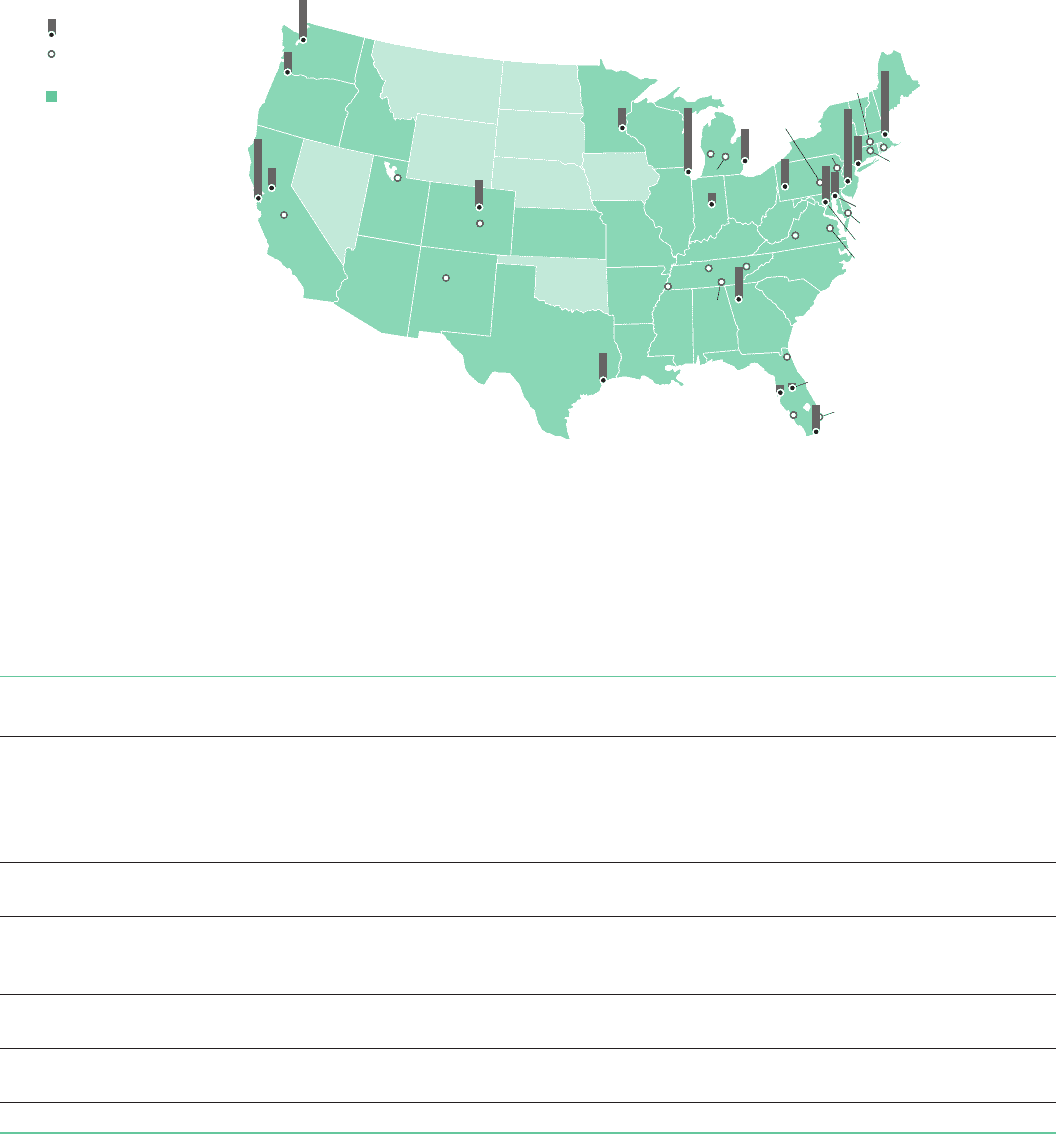
The Areas We Serve
The map below highlights our 40 major markets with emphasis on our operations in the top 25 U.S. TV markets. Approximately 90% of
our video subscribers are in the markets listed (subscribers in thousands).
*As of January 1, 2007
West Palm Beach
Nashville
Hartford
Grand
Rapids
Salt Lake
City
Houston*
700
Atlanta
800
Baltimore 600
Washington, D.C. 900
Philadelphia 1,800
New York 700
Boston 1,600
Pittsburgh
700
Detroit
800
Miami 700
Orlando 100
Tampa 200
Indianapolis
300
Chicago
1,600
Minneapolis /
St. Paul
500
Denver 700
Seattle 1,000
Portland 500
Sacramento
500
San Francisco
1,500
Top 25 U.S. TV Markets
Top 40 Comcast Markets
(>125,000 subscribers)
States in footprint
Jacksonville
Ft. Myers
Richmond
Memphis
Fresno
Albuquerque
Providence
Salisbury
Knoxville
Springfield
Roanoke
Lansing
Wilkes-
Barre
Chattanooga
Colorado Springs
Harrisburg