Comcast 2006 Annual Report Download - page 32
Download and view the complete annual report
Please find page 32 of the 2006 Comcast annual report below. You can navigate through the pages in the report by either clicking on the pages listed below, or by using the keyword search tool below to find specific information within the annual report.-
 1
1 -
2
-
3
-
4
-
5
-
6
-
7
-
8
-
9
-
10
-
11
-
12
-
13
-
14
-
15
-
16
-
17
-
18
-
19
-
20
-
21
-
 22
22 -
 23
23 -
 24
24 -
 25
25 -
 26
26 -
 27
27 -
 28
28 -
 29
29 -
 30
30 -
 31
31 -
 32
32 -
 33
33 -
 34
34 -
 35
35 -
 36
36 -
 37
37 -
 38
38 -
 39
39 -
 40
40 -
 41
41 -
 42
42 -
43
-
44
-
45
-
46
-
47
-
48
-
49
-
50
-
51
-
52
-
53
-
54
-
55
-
56
-
57
-
58
-
59
-
60
-
61
-
62
-
63
-
64
-
65
-
66
-
67
-
68
-
69
-
70
-
71
-
72
-
73
-
74
-
75
-
76
-
77
-
78
-
79
-
80
-
81
-
82
-
83
-
84
 |
 |

MD&A Comcast 2006 Annual Report 30
Advertising. As part of our programming license agreements with
programming networks, we receive an allocation of scheduled
advertising time that we may sell to local, regional and national
advertisers. We also coordinate the advertising sales efforts of other
cable operators in some markets, and in other markets we have
formed and operate advertising interconnects, which establish a
physical, direct link between multiple cable systems and provide
for the sale of regional and national advertising across larger geo-
graphic areas than could be provided by a single cable operator.
Advertising revenues increased in 2006 as a result of the strong
growth in political advertising and the addition of our newly acquired
cable systems. We expect slower growth in our advertising revenues
in 2007, primarily as a result of lower levels of political advertising.
Other. We also generate revenues from our regional sports and
news networks, video installation services, commissions from
third-party electronic retailing, and fees for other services, such as
providing businesses with data connectivity and networked appli-
cations. Our regional sports and news networks include Comcast
SportsNet (Philadelphia), Comcast SportsNet Mid-Atlantic (Balti-
more/Washington), Cable Sports Southeast, CN8 — The Comcast
Network, Comcast SportsNet Chicago, Comcast SportsNet West
(Sacramento) and MountainWest Sports Network. These networks
earn revenue through the sale of advertising time and receive pro-
gramming license fees paid by cable and satellite distributors.
Franchise Fees. Our franchise fee revenues represent the pass-
through to our subscribers of the fees required to be paid to state
and local franchising authorities. Under the terms of our franchise
agreements, we are generally required to pay up to 5% of our gross
video revenues to the local franchising authority. The increases in
franchise fees are primarily a result of the increases in our revenues
upon which the fees apply.
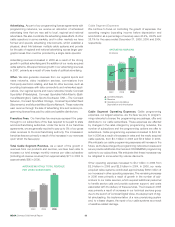
Total Cable Segment Revenue. As a result of the growth in
revenues from our products and services, we have been able to
increase our total average monthly revenue per video subscriber
(including all revenue sources) from approximately $77 in 2004 to
approximately $95 in 2006.
AVERAGE MONTHLY TOTAL REVENUE
PER VIDEO SUBSCRIBER
$77
$84
$95
200620052004
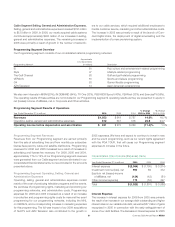
Cable Segment Expenses
We continue to focus on controlling the growth of expenses. Our
operating margins (operating income before depreciation and
amortization as a percentage of revenue) were 40.2%, 39.8% and
38.1% for the years ended December 31, 2006, 2005 and 2004,
respectively.
OPERATING MARGINS
(in billions)
$6.9 $7.9
$9.7
200620052004
$18.2
$20.0
$24.1
30
45
38%
40% 40%
Operating Margins
Revenue
Operating Income Before
Depreciation and Amortization
Cable Segment Operating Expenses. Cable programming
expenses, our largest expense, are the fees we pay to program-
ming networks to license the programming we package, offer and
distribute to our cable subscribers. These expenses are affected
by changes in the rates charged by programming networks, the
number of subscribers and the programming options we offer to
subscribers. Cable programming expenses increased to $4.9 bil-
lion in 2006 as a result of increases in rates and the newly acquired
cable systems, from $4.1 billion in 2005 and $3.9 billion in 2004.
We anticipate our cable programming expenses will increase in the
future, as the fees charged by programming networks increase and
as we provide additional channels and ON DEMAND programming
options to our subscribers. We anticipate that these increases may
be mitigated to some extent by volume discounts.
Other operating expenses increased to $3.7 billion in 2006 from
$2.9 billion in 2005 and $2.8 billion in 2004. In 2006, our newly
acquired cable systems contributed approximately $650 million of
our increases in other operating expenses. The remaining increases
in 2006 were primarily a result of growth in the number of sub-
scribers to our cable services, which required additional personnel
to handle service calls and provide customer support, and costs
associated with the delivery of these services. The increase in 2005
was primarily a result of increases in our technical services group
due to the launch of Comcast Digital Voice, the deployment of digi-
tal simulcasting, the implementation of a new provisioning system
and, to a lesser degree, the repair of our cable systems as a result
of weather-related damage.
■
■