Comcast 2006 Annual Report Download - page 43
Download and view the complete annual report
Please find page 43 of the 2006 Comcast annual report below. You can navigate through the pages in the report by either clicking on the pages listed below, or by using the keyword search tool below to find specific information within the annual report.-
 1
1 -
2
-
3
-
4
-
5
-
6
-
7
-
8
-
9
-
10
-
11
-
12
-
13
-
14
-
15
-
16
-
17
-
18
-
19
-
20
-
21
-
22
-
23
-
24
-
25
-
26
-
27
-
28
-
29
-
30
-
31
-
32
-
 33
33 -
 34
34 -
 35
35 -
 36
36 -
 37
37 -
 38
38 -
 39
39 -
 40
40 -
 41
41 -
 42
42 -
 43
43 -
 44
44 -
 45
45 -
 46
46 -
 47
47 -
 48
48 -
 49
49 -
 50
50 -
 51
51 -
 52
52 -
 53
53 -
54
-
55
-
56
-
57
-
58
-
59
-
60
-
61
-
62
-
63
-
64
-
65
-
66
-
67
-
68
-
69
-
70
-
71
-
72
-
73
-
74
-
75
-
76
-
77
-
78
-
79
-
80
-
81
-
82
-
83
-
84
 |
 |

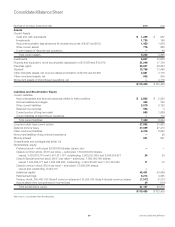
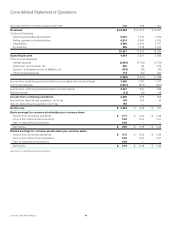
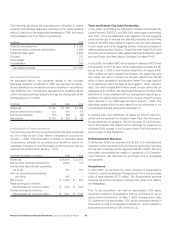
41 Comcast 2006 Annual Report
Year Ended December 31 (in millions) 2006 2005 2004
Operating Activities
Net income $ 2,533 $ 928 $ 970
Adjustments to reconcile net income to net cash provided by operating activities:
Depreciation 3,828 3,413 3,197
Amortization 995 1,138 1,154
Depreciation and amortization of discontinued operations 139 253 272
Share-based compensation expenses 190 56 33
Noncash interest expense, net 99 8 33
Equity in net losses (income) of affiliates, net 124 42 81
(Gains) losses on investments and noncash other (income) expense, net (979) (54) (703)
Gain on discontinued operations (736) — —
Noncash contribution expense 33 10 25
Minority interest 12 19 14
Deferred income taxes 674 183 531
Proceeds from sales of trading securities — — 680
Changes in operating assets and liabilities, net of effects of acquisitions and divestitures:
Change in accounts receivable, net (357) (97) (54)
Change in accounts payable and accrued expenses related to trade creditors 560 (152) (163)
Change in other operating assets and liabilities (497) (912) 12
Net cash provided by (used in) operating activities 6,618 4,835 6,082
Financing Activities
Proceeds from borrowings 7,497 3,978 1,030
Retirements and repayments of debt (2,039) (2,706) (2,323)
Repurchases of common stock (2,347) (2,313) (1,361)
Issuances of common stock 410 93 113
Other 25 15 25
Net cash provided by (used in) financing activities 3,546 (933) (2,516)
Investing Activities
Capital expenditures (4,395) (3,621) (3,660)
Cash paid for intangible assets (306) (281) (615)
Acquisitions, net of cash acquired (5,110) (199) (296)
Proceeds from sales and restructuring of investments 2,720 861 228
Purchases of investments (2,812) (306) (156)
Proceeds from sales (purchases) of short-term investments, net 33 (86) (13)
Proceeds from settlement of contract of acquired company — — 26
Other (2) (116) (26)
Net cash provided by (used in) investing activities (9,872) (3,748) (4,512)
Increase (decrease) in cash and cash equivalents 292 154 (946)
Cash and cash equivalents, beginning of year 947 793 1,739
Cash and cash equivalents, end of year $ 1,239 $ 947 $ 793
See notes to consolidated financial statements.
Consolidated Statement of Cash Flows