Comcast 2006 Annual Report Download - page 73
Download and view the complete annual report
Please find page 73 of the 2006 Comcast annual report below. You can navigate through the pages in the report by either clicking on the pages listed below, or by using the keyword search tool below to find specific information within the annual report.-
 1
1 -
2
-
3
-
4
-
5
-
6
-
7
-
8
-
9
-
10
-
11
-
12
-
13
-
14
-
15
-
16
-
17
-
18
-
19
-
20
-
21
-
22
-
23
-
24
-
25
-
26
-
27
-
28
-
29
-
30
-
31
-
32
-
33
-
34
-
35
-
36
-
37
-
38
-
39
-
40
-
41
-
42
-
43
-
44
-
45
-
46
-
47
-
48
-
49
-
50
-
51
-
52
-
53
-
54
-
55
-
56
-
57
-
58
-
59
-
60
-
61
-
62
-
 63
63 -
 64
64 -
 65
65 -
 66
66 -
 67
67 -
 68
68 -
 69
69 -
 70
70 -
 71
71 -
 72
72 -
 73
73 -
 74
74 -
 75
75 -
 76
76 -
 77
77 -
 78
78 -
 79
79 -
 80
80 -
 81
81 -
 82
82 -
 83
83 -
84
 |
 |

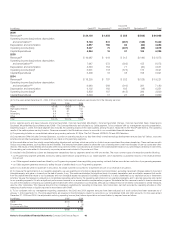
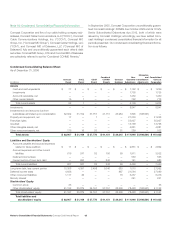
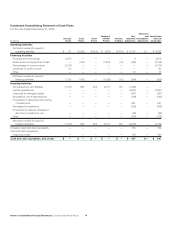
71 Comcast 2006 Annual Report Notes to Consolidated Financial Statements
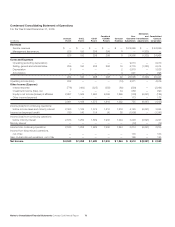
Condensed Consolidating Statement of Operations
For the Year Ended December 31, 2005
Elimination
Combined Non- and Consolidated
Comcast CCCL CCCH CCHMO Comcast Guarantor Consolidation Comcast
(in millions) Parent Parent Parent Parents Holdings Subsidiaries Adjustments Corporation
Revenues
Service revenues $ — $ — $ — $ — $ — $ 21,075 $ — $ 21.075
Management fee revenue 457 174 278 278 8 — (1,195) —
457 174 278 278 8 21,075 (1,195) 21,075
Costs and Expenses
Operating (excluding depreciation) — — — — — 7,513 — 7,513
Selling, general and administrative 204 174 278 278 15 5,736 (1,195) 5,490
Depreciation 3 — — — 3 3,407 — 3,413
Amortization — — — — 10 1,128 — 1,138
207 174 278 278 28 17,784 (1,195) 17,554
Operating income (loss) 250 — — — (20) 3,291 — 3,521
Other Income (Expense)
Interest expense (371) (477) (329) (306) (101) (211) — (1,795)
Investment income (loss), net — — — — (16) 105 — 89
Equity in net income (losses) of affiliates 1,007 1,372 605 804 977 43 (4,850) (42)
Other income (expense) — — — — — (53) — (53)
636 895 276 498 860 (116) (4,850) (1,801)
Income (loss) from continuing operations
before income taxes and minority interest 886 895 276 498 840 3,175 (4,850) 1,720
Income tax (expense) benefit 42 167 115 107 48 (1,352) — (873)
Income (loss) from continuing operations
before minority interest 928 1,062 391 605 888 1,823 (4,850) 847
Minority interest — — — — — (19) — (19)
Income from continuing operations $ 928 $ 1,062 $ 391 $ 605 $ 888 $ 1,804 $ (4,850) $ 828
Income from discontinued operations,
net of tax — — — — — 100 — 100
Net Income $ 928 $ 1,062 $ 391 $ 605 $ 888 $ 1,904 $ (4,850) $ 928