Comcast 2006 Annual Report Download - page 74
Download and view the complete annual report
Please find page 74 of the 2006 Comcast annual report below. You can navigate through the pages in the report by either clicking on the pages listed below, or by using the keyword search tool below to find specific information within the annual report.-
 1
1 -
2
-
3
-
4
-
5
-
6
-
7
-
8
-
9
-
10
-
11
-
12
-
13
-
14
-
15
-
16
-
17
-
18
-
19
-
20
-
21
-
22
-
23
-
24
-
25
-
26
-
27
-
28
-
29
-
30
-
31
-
32
-
33
-
34
-
35
-
36
-
37
-
38
-
39
-
40
-
41
-
42
-
43
-
44
-
45
-
46
-
47
-
48
-
49
-
50
-
51
-
52
-
53
-
54
-
55
-
56
-
57
-
58
-
59
-
60
-
61
-
62
-
63
-
 64
64 -
 65
65 -
 66
66 -
 67
67 -
 68
68 -
 69
69 -
 70
70 -
 71
71 -
 72
72 -
 73
73 -
 74
74 -
 75
75 -
 76
76 -
 77
77 -
 78
78 -
 79
79 -
 80
80 -
 81
81 -
 82
82 -
 83
83 -
 84
84
 |
 |

Notes to Consolidated Financial Statements Comcast 2006 Annual Report 72
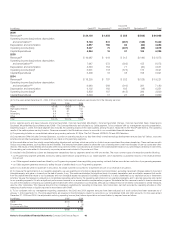
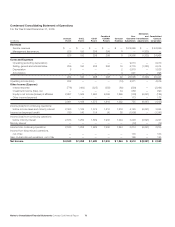
Condensed Consolidating Statement of Operations
For the Year Ended December 31, 2004
Elimination
Combined Non- and Consolidated
Comcast CCCL CCCH CCHMO Comcast Guarantor Consolidation Comcast
(in millions) Parent Parent Parent Parents Holdings Subsidiaries Adjustments Corporation
Revenues
Service revenues $ — $ — $ — $ — $ — $ 19,221 $ — $ 19,221
Management fee revenue 416 161 253 253 8 — (1,091) —
416 161 253 253 8 19,221 (1,091) 19,221
Costs and Expenses
Operating (excluding depreciation) — — — — — 7,036 — 7,036
Selling, general and administrative 168 161 253 253 13 5,248 (1,091) 5,005
Depreciation 2 — — — 3 3,192 — 3,197
Amortization — — — — 11 1,143 — 1,154
170 161 253 253 27 16,619 (1,091) 16,392
Operating income (loss) 246 — — — (19) 2,602 — 2,829
Other Income (Expense)
Interest expense (289) (474) (348) (399) (98) (266) — (1,874)
Investment income (loss), net — — — — 100 372 — 472
Equity in net income (losses) of affiliates 998 1,170 310 569 997 (216) (3,909) (81)
Other income (expense) — — — — — 397 — 397
709 696 (38) 170 999 287 (3,909) (1,086)
Income (loss) from continuing operations
before income taxes and minority interest 955 696 (38) 170 980 2,889 (3,909) 1,743
Income tax (expense) benefit 15 166 122 140 6 (1,250) — (801)
Income (loss) from continuing operations
before minority interest 970 862 84 310 986 1,639 (3,909) 942
Minority interest — — — — — (14) — (14)
Income from continuing operations 970 862 84 310 986 1,625 (3,909) 928
Income from discontinued operations,
net of tax — — — — — 42 — 42
Net Income $ 970 $ 862 $ 84 $ 310 $ 986 $ 1,667 $ (3,909) $ 970