Comcast 2006 Annual Report Download - page 55
Download and view the complete annual report
Please find page 55 of the 2006 Comcast annual report below. You can navigate through the pages in the report by either clicking on the pages listed below, or by using the keyword search tool below to find specific information within the annual report.-
 1
1 -
2
-
3
-
4
-
5
-
6
-
7
-
8
-
9
-
10
-
11
-
12
-
13
-
14
-
15
-
16
-
17
-
18
-
19
-
20
-
21
-
22
-
23
-
24
-
25
-
26
-
27
-
28
-
29
-
30
-
31
-
32
-
33
-
34
-
35
-
36
-
37
-
38
-
39
-
40
-
41
-
42
-
43
-
44
-
 45
45 -
 46
46 -
 47
47 -
 48
48 -
 49
49 -
 50
50 -
 51
51 -
 52
52 -
 53
53 -
 54
54 -
 55
55 -
 56
56 -
 57
57 -
 58
58 -
 59
59 -
 60
60 -
 61
61 -
 62
62 -
 63
63 -
 64
64 -
 65
65 -
66
-
67
-
68
-
69
-
70
-
71
-
72
-
73
-
74
-
75
-
76
-
77
-
78
-
79
-
80
-
81
-
82
-
83
-
84
 |
 |

53 Comcast 2006 Annual Report Notes to Consolidated Financial Statements
Equity Method
Our recorded investments exceed our proportionate interests in
the book value of the investees’ net assets by $984 million and
$1.210 billion as of December 31, 2006 and 2005, respectively
(principally related to our investments in TKCCP (50% interest),
Insight Midwest (50% interest), and MGM (20% interest)). A por-
tion of this basis difference has been attributed to franchise-related
customer relationships of some of the investees. This difference is
amortized to equity in (loss) income of affiliates, net over a period of
four years. The portion of the basis difference attributable to good-
will is tested for impairment annually, or more frequently whenever
events or changes in circumstances indicate that the investment
might be impaired.
SpectrumCo, LLC
SpectrumCo, LLC (“SpectrumCo”), a consortium of investors includ-
ing us, was the successful bidder for 137 wireless spectrum
licenses for approximately $2.4 billion in the Federal Communi-
cations Commission’s advanced wireless spectrum auction that
concluded in September 2006. Our portion of the total cost to
purchase the licenses was approximately $1.3 billion. Based on its
currently planned activities, we have determined that SpectrumCo
is not a VIE. We account for this joint venture as an equity method
investment based on its governance structure, notwithstanding our
majority interest.
Dissolution of TKCCP
In October 2006, we contributed $1.362 billion to TKCCP to refi-
nance the outstanding bank and partnership debt of the Houston
Asset Pool. We have historically accounted for our interest in
TKCCP as an equity method investment. However, effective July 1,
2006 (the beginning of the month when dissolution was initiated),
the economic return to us on our interest in TKCCP tracked the
performance of the Houston Asset Pool, and we were no longer
entitled to any benefits of ownership or responsible for the obliga-
tions of the Kansas City Asset Pool. As a result, we began reporting
our share of the earnings and losses of TKCCP based solely on the
operating results of the Houston Asset Pool. For segment reporting
purposes, we have included the operating results of the Houston
Asset Pool in our Cable segment. However, the operating results of
the Houston Asset Pool are eliminated in our consolidated financial
statements (see Note 14). On January 1, 2007, the distribution of
assets of TKCCP was completed and we received the Houston
Asset Pool (see Note 5).
MGM
In April 2005, we completed a transaction with a group of investors
to acquire Metro-Goldwyn-Mayer Inc. We acquired a 20% eco-
nomic interest for approximately $250 million in cash.
DHC Ventures, LLC
In September 2004, we sold our 20% interest in DHC Ventures,
LLC (“Discovery Health Channel”) to Discovery Communications,
Inc. for approximately $149 million in cash and recognized a gain
on the sale of approximately $94 million to other income.
Cost Method
AirTouch Communications, Inc.
We hold two series of preferred stock of AirTouch Communica-
tions, Inc. (“AirTouch”), a subsidiary of Vodafone, that are recorded
at $1.451 billion and $1.437 billion as of December 31, 2006 and
2005, respectively. The dividend and redemption activity of the
AirTouch preferred stock is tied to the dividend and redemption
payments associated with substantially all of the preferred shares
issued by one of our consolidated subsidiaries, which is a VIE. The
subsidiary has three series of preferred stock outstanding with an
aggregate redemption value of $1.750 billion. Substantially all of
the preferred shares are redeemable in April 2020 at a redemp-
tion value of $1.650 billion, with one of the series bearing a 9.08%
dividend rate. The two redeemable series of subsidiary preferred
shares are recorded at $1.451 billion and $1.437 billion, and such
amounts are included in other noncurrent liabilities as of Decem-
ber 31, 2006 and 2005, respectively. The non-redeemable series
of subsidiary preferred shares is recorded at $100 million as of both
December 31, 2006 and 2005, and such amounts are included in
minority interest.
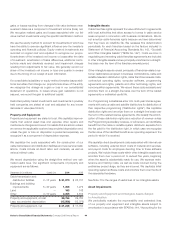
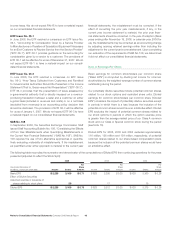
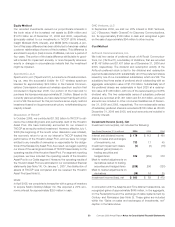
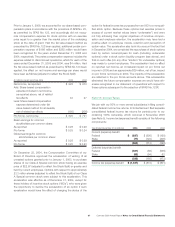
Investment Income (Loss), Net
Investment income (loss), net includes the following:
Year Ended December 31 (in millions) 2006 2005 2004
Interest and dividend income $ 178 $ 112 $ 160
Gains on sales and exchanges
of investments, net 733 17 45
Investment impairment losses (4) (3) (16)
Unrealized gains (losses) on
trading securities and
hedged items 339 (259) 378
Mark to market adjustments on
derivatives related to trading
securities and hedged items (238) 206 (120)
Mark to market adjustments on
derivatives (18) 16 25
Investment income (loss), net $ 990 $ 89 $ 472
In connection with the Adelphia and Time Warner transactions, we
recognized gains of approximately $646 million, in the aggregate,
on the Redemptions and the exchange of cable systems held by
Century and Parnassos (see Note 5). These gains are included
within the “Gains on sales and exchanges of investments, net”
caption in the table above.