Comcast 2006 Annual Report Download - page 30
Download and view the complete annual report
Please find page 30 of the 2006 Comcast annual report below. You can navigate through the pages in the report by either clicking on the pages listed below, or by using the keyword search tool below to find specific information within the annual report.-
 1
1 -
2
-
3
-
4
-
5
-
6
-
7
-
8
-
9
-
10
-
11
-
12
-
13
-
14
-
15
-
16
-
17
-
18
-
19
-
 20
20 -
 21
21 -
 22
22 -
 23
23 -
 24
24 -
 25
25 -
 26
26 -
 27
27 -
 28
28 -
 29
29 -
 30
30 -
 31
31 -
 32
32 -
 33
33 -
 34
34 -
 35
35 -
 36
36 -
 37
37 -
 38
38 -
 39
39 -
 40
40 -
41
-
42
-
43
-
44
-
45
-
46
-
47
-
48
-
49
-
50
-
51
-
52
-
53
-
54
-
55
-
56
-
57
-
58
-
59
-
60
-
61
-
62
-
63
-
64
-
65
-
66
-
67
-
68
-
69
-
70
-
71
-
72
-
73
-
74
-
75
-
76
-
77
-
78
-
79
-
80
-
81
-
82
-
83
-
84
 |
 |

MD&A Comcast 2006 Annual Report 28
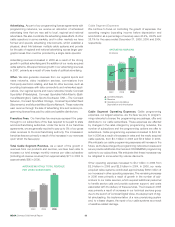
50.8 million RGUs. As a result of continued and growing demand
for our existing and new products and services, including our triple
play offering, as well as other factors discussed below, we have
increased our revenues and operating income before depreciation
and amortization.
REVENUE AND OPERATING INCOME
BEFORE DEPRECIATION AND
AMORTIZATION
(in billions)
$18.2
$20.0
$24.1
$6.9 $7.9
$9.7
200620052004
Revenue
Operating Income Before
Depreciation and Amortization
Cable Segment Results of Operations
The comparability of the results of operations and subscriber infor-
mation of our Cable segment are impacted by the Adelphia and
Time Warner transactions (closed July 31, 2006) and the acquisi-
tion of the cable systems of Susquehanna Communications (closed
■
■
April 30, 2006). Further, consistent with our management report-
ing presentation, the operating results and subscriber information
of the cable systems serving Houston, Texas have been included
in the Cable segment beginning August 1, 2006. However, the
operating results of the Houston cable systems are eliminated in
our consolidated financial statements as TKCCP continued to be
accounted for as an equity method investment for external financial
reporting purposes until the Houston cable systems were actually
acquired on January 1, 2007 (see Note 5). We collectively refer
to these cable systems as the “newly acquired cable systems.”
The newly acquired cable systems accounted for $1.7 billion of
increased revenue in 2006.
Cable Segment Revenues
Video. We offer a full range of video services, ranging from a lim-
ited basic service and a digital starter service, to our full digital
cable service, which provides access to over 250 channels, includ-
ing premium and pay-per-view channels; ON DEMAND (which
allows access to a library of movies, sports and news, starting a
selection at any time, and pausing, rewinding and fast-forwarding
selections); music channels; and an interactive, on-screen program
guide (which allows navigating the channel lineup and ON DEMAND
library). Digital cable subscribers may also subscribe to additional
digital cable services, including DVR (which allows digital record-
ing of programs, and pausing and rewinding of live television), and
HDTV (which provides multiple channels in high definition).
As of December 31, 2006, approximately 52% of our video sub-
scribers subscribed to at least one of our digital cable services,
compared to approximately 45% and approximately 39% as of
December 31, 2005 and 2004, respectively.
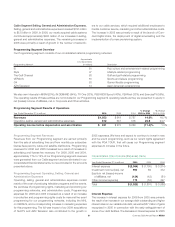
% Change % Change
Year Ended December 31 (in millions) 2006 2005 2004 2005 to 2006 2004 to 2005
Video $ 15,096 $ 12,918 $ 12,211 16.9% 5.8%
High-speed Internet 4,986 3,757 2,938 32.7 27.9
Phone 913 617 620 48.0 (0.5)
Advertising 1,537 1,272 1,206 20.8 5.4
Other 851 789 654 7.8 20.7
Franchise fees 717 634 601 13.1 5.3
Revenues 24,100 19,987 18,230 20.6 9.6
Operating expenses 8,600 7,041 6,656 22.1 5.8
Selling, general and administrative expenses 5,796 4,999 4,634 15.9 7.8
Operating income before depreciation and amortization $ 9,704 $ 7,947 $ 6,940 22.1% 14.5%