Comcast 2006 Annual Report Download - page 71
Download and view the complete annual report
Please find page 71 of the 2006 Comcast annual report below. You can navigate through the pages in the report by either clicking on the pages listed below, or by using the keyword search tool below to find specific information within the annual report.-
 1
1 -
2
-
3
-
4
-
5
-
6
-
7
-
8
-
9
-
10
-
11
-
12
-
13
-
14
-
15
-
16
-
17
-
18
-
19
-
20
-
21
-
22
-
23
-
24
-
25
-
26
-
27
-
28
-
29
-
30
-
31
-
32
-
33
-
34
-
35
-
36
-
37
-
38
-
39
-
40
-
41
-
42
-
43
-
44
-
45
-
46
-
47
-
48
-
49
-
50
-
51
-
52
-
53
-
54
-
55
-
56
-
57
-
58
-
59
-
60
-
 61
61 -
 62
62 -
 63
63 -
 64
64 -
 65
65 -
 66
66 -
 67
67 -
 68
68 -
 69
69 -
 70
70 -
 71
71 -
 72
72 -
 73
73 -
 74
74 -
 75
75 -
 76
76 -
 77
77 -
 78
78 -
 79
79 -
 80
80 -
 81
81 -
82
-
83
-
84
 |
 |

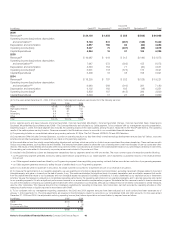
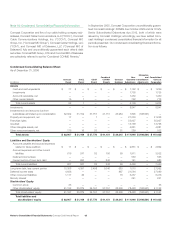
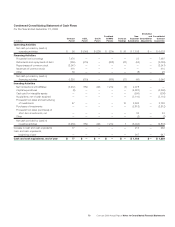
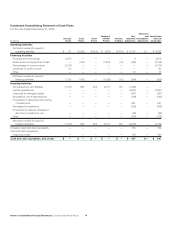
69 Comcast 2006 Annual Report Notes to Consolidated Financial Statements
Condensed Consolidating Balance Sheet
As of December 31, 2005
Elimination
Combined Non- and Consolidated
Comcast CCCL CCCH CCHMO Comcast Guarantor Consolidation Comcast
(in millions) Parent Parent Parent Parents Holdings Subsidiaries Adjustments Corporation
Assets
Cash and cash equivalents $ — $ — $ — $ — $ — $ 947 $ — $ 947
Investments — — — — — 148 — 148
Accounts receivable, net — — — — — 1,008 — 1,008
Other current assets 16 — — — — 669 — 685
Current assets of discontinued operations — — — — — 60 — 60
Total current assets 16 — — — — 2,832 — 2,848
Investments — — — — — 12,675 — 12,675
Investments in and amounts due from
subsidiaries eliminated upon consolidation 53,103 29,562 36,042 40,482 22,742 955 (182,886) —
Property and equipment, net 11 — 2 — 3 17,688 — 17,704
Franchise rights — — — — — 48,804 — 48,804
Goodwill — — — — — 13,498 — 13,498
Other intangible assets, net — — — — 4 3,114 — 3,118
Other noncurrent assets, net 122 21 23 — 43 426 — 635
Other noncurrent assets of discontinued
operations, net — — — — — 4,118 — 4,118
Total assets $ 53,252 $ 29,583 $ 36,067 $ 40,482 $ 22,792 $ 104,110 $ (182,886) $ 103,400
Liabilities and Stockholders’ Equity
Accounts payable and accrued expenses
related to trade creditors $ — $ — $ — $ — $ — $ 2,239 $ — $ 2,239
Accrued expenses and other current
liabilities 447 224 113 127 89 1,482 — 2,482
Deferred income taxes — — — — — 2 — 2
Current portion of long-term debt — 620 — 995 — 74 — 1,689
Current liability of discontinued operations — — — — — 112 — 112
Total current liabilities 447 844 113 1,122 89 3,909 — 6,524
Long term-debt, less current portion 8,243 4,988 3,498 3,318 981 654 — 21,682
Deferred income taxes 3,470 — — — 811 23,089 — 27,370
Other noncurrent liabilities 873 54 — — 50 5,943 — 6,920
Minority interest — — — — — 657 — 657
Noncurrent liabilities of discontinued
operations — — — — — 28 — 28
Stockholders’ Equity
Common stock 36 — — — — — — 36
Other stockholders’ equity 40,183 23,697 32,456 36,042 20,861 69,830 (182,886) 40,183
Total stockholders’ equity 40,219 23,697 32,456 36,042 20,861 69,830 (182,886) 40,219
Total liabilities and
stockholders’ equity $ 53,252 $ 29,583 $ 36,067 $ 40,482 $ 22,792 $ 104,110 $ (182,886) $ 103,400