Comcast 2006 Annual Report Download - page 58
Download and view the complete annual report
Please find page 58 of the 2006 Comcast annual report below. You can navigate through the pages in the report by either clicking on the pages listed below, or by using the keyword search tool below to find specific information within the annual report.-
 1
1 -
2
-
3
-
4
-
5
-
6
-
7
-
8
-
9
-
10
-
11
-
12
-
13
-
14
-
15
-
16
-
17
-
18
-
19
-
20
-
21
-
22
-
23
-
24
-
25
-
26
-
27
-
28
-
29
-
30
-
31
-
32
-
33
-
34
-
35
-
36
-
37
-
38
-
39
-
40
-
41
-
42
-
43
-
44
-
45
-
46
-
47
-
 48
48 -
 49
49 -
 50
50 -
 51
51 -
 52
52 -
 53
53 -
 54
54 -
 55
55 -
 56
56 -
 57
57 -
 58
58 -
 59
59 -
 60
60 -
 61
61 -
 62
62 -
 63
63 -
 64
64 -
 65
65 -
 66
66 -
 67
67 -
 68
68 -
69
-
70
-
71
-
72
-
73
-
74
-
75
-
76
-
77
-
78
-
79
-
80
-
81
-
82
-
83
-
84
 |
 |

Notes to Consolidated Financial Statements Comcast 2006 Annual Report 56
borrowings under the credit facility is LIBOR plus 0.35% based on
our credit ratings.
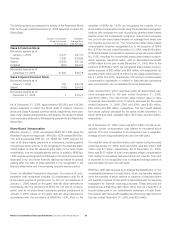
Lines and Letters of Credit
As of December 31, 2006, we and certain of our subsidiaries had
unused lines of credit totaling $4.464 billion under various credit
facilities and unused irrevocable standby letters of credit totaling
$377 million to cover potential fundings under various agreements.
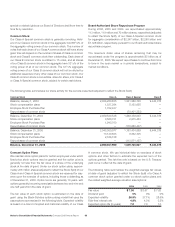
ZONES
At maturity, holders of our 2.0% Exchangeable Subordinated
Debentures due 2029 (the “ZONES”) are entitled to receive in
cash an amount equal to the higher of the principal amount of
the outstanding ZONES of $1.807 billion or the market value of
24,124,398 shares of Sprint Nextel common stock and 1,205,049
shares of Embarq common stock. Prior to maturity, each ZONES
is exchangeable at the holder’s option for an amount of cash equal
to 95% of the aggregate market value of one share of Sprint Nextel
common stock and 0.05 shares of Embarq common stock.
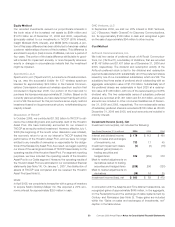
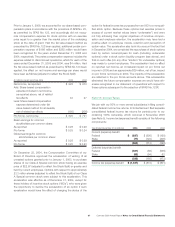
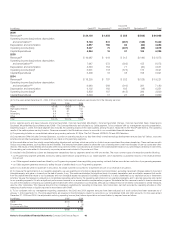
We separate the accounting for the ZONES into derivative and debt
components. We record the change in the fair value of the deriva-
tive component of the ZONES (see Note 6) and the change in the
carrying value of the debt component of the ZONES as follows:
Year Ended December 31, 2006 Debt Derivative
(in millions) Component Component Total
Balance at beginning of year $ 568 $ 184 $ 752
Change in debt component
to interest expense 28 — 28
Change in derivative
component to investment
income (loss), net — (33) (33)
Balance at end of year $ 596 $ 151 $ 747
Interest Rates
Excluding the derivative component of our Exchangeable Notes
due 2007 and the ZONES whose changes in fair value are recorded
to investment income (loss), net, our effective weighted-average
interest rate on our total debt outstanding was 7.07% and 7.32%
as of December 31, 2006 and 2005, respectively. As of Decem-
ber 31, 2006 and 2005, accrued interest was $501 million and
$422 million, respectively.
Interest Rate Risk Management
We are exposed to the market risk of adverse changes in inter-
est rates. To manage the volatility relating to these exposures,
our policy is to maintain a mix of fixed-rate and variable-rate debt
and to enter into various interest rate derivative transactions as
described below.
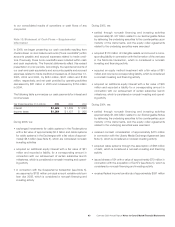
Using swaps, we agree to exchange, at specified intervals, the
difference between fixed and variable interest amounts calculated
by reference to an agreed-upon notional principal amount. Rate
locks are sometimes used to hedge the risk that the cash flows
related to the interest payments on an anticipated issuance or
assumption of fixed-rate debt may be adversely affected by inter-
est rate fluctuations.
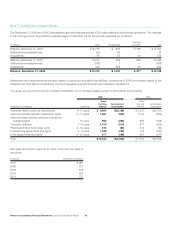
The following table summarizes the terms of our existing swaps:
Notional Average Average Estimated
(in millions) Amount Maturities Pay Rate Receive Rate Fair Value
As of December 31, 2006
Fixed to Variable Swaps $ 3,200 2008 – 2014 7.2% 5.9% $ (103)
As of December 31, 2005
Fixed to Variable Swaps $ 3,600 2006 – 2014 6.5% 6.0% $ (97)
The notional amounts of interest rate instruments, as presented in
the above table, are used to measure interest to be paid or received
and do not represent the amount of exposure to credit loss. The
estimated fair value approximates the proceeds or payments to
settle the outstanding contracts. Swaps and rate locks represent
an integral part of our interest rate risk management program. The
effect of our interest rate derivative financial instruments was to
increase our interest expense by approximately $39 million in 2006,
and to decrease our interest expense by approximately $16 million
and $66 million in 2005 and 2004, respectively.
We have entered into rate locks to hedge the risk that the cash
flows related to the interest payments on an anticipated issuance
or assumption of fixed-rate debt may be adversely affected by
interest-rate fluctuations. Upon the issuance or assumption of
fixed-rate debt, the value of the rate locks is being recognized as
an adjustment to interest expense, similar to a deferred financing
cost, over the same period in which the related interest costs on the
debt are recognized in earnings (approximately 11 years remaining,
unless earlier retired). The unrealized pretax losses on cash flow
hedges as of December 31, 2006 and 2005, of $185 million and