Comcast 2006 Annual Report Download - page 35
Download and view the complete annual report
Please find page 35 of the 2006 Comcast annual report below. You can navigate through the pages in the report by either clicking on the pages listed below, or by using the keyword search tool below to find specific information within the annual report.-
 1
1 -
2
-
3
-
4
-
5
-
6
-
7
-
8
-
9
-
10
-
11
-
12
-
13
-
14
-
15
-
16
-
17
-
18
-
19
-
20
-
21
-
22
-
23
-
24
-
 25
25 -
 26
26 -
 27
27 -
 28
28 -
 29
29 -
 30
30 -
 31
31 -
 32
32 -
 33
33 -
 34
34 -
 35
35 -
 36
36 -
 37
37 -
 38
38 -
 39
39 -
 40
40 -
 41
41 -
 42
42 -
 43
43 -
 44
44 -
 45
45 -
46
-
47
-
48
-
49
-
50
-
51
-
52
-
53
-
54
-
55
-
56
-
57
-
58
-
59
-
60
-
61
-
62
-
63
-
64
-
65
-
66
-
67
-
68
-
69
-
70
-
71
-
72
-
73
-
74
-
75
-
76
-
77
-
78
-
79
-
80
-
81
-
82
-
83
-
84
 |
 |

33 Comcast 2006 Annual Report MD&A
$7.497 billion, partially offset by our debt repayments of $2.039 bil-
lion, and our repurchase of approximately 113 million shares of our
Class A Special common stock at a weighted-average share price
of $20.76 for $2.347 billion (recognized on a settlement date or
cash basis and adjusted to reflect the Stock Split). We have made,
and may from time to time in the future make, optional repayments
on our debt obligations, which may include repurchases of our
outstanding public notes and debentures, depending on various
factors, such as market conditions. See Note 8 to our consolidated
financial statements for further discussion of our financing activi-
ties, including details of our debt repayments and borrowings.
Available Borrowings Under Credit Facilities
We traditionally maintain significant availability under lines of credit
and our commercial paper program to meet our short-term liquidity
requirements. As of December 31, 2006, amounts available under
these facilities totaled $4.464 billion.
Debt Covenants
We and our cable subsidiaries that have provided guarantees (see
Note 8) are subject to the covenants and restrictions set forth in the
indentures governing our public debt securities and in the credit
agreement governing our bank credit facilities. We and the guar-
antors are in compliance with the covenants, and we believe that
neither the covenants nor the restrictions in our indentures or loan
documents will limit our ability to operate our business or raise
additional capital. Our covenants are tested on an ongoing basis.
The only financial covenant in our $5.0 billion revolving credit facility
relates to leverage (ratio of debt to operating income before depre-
ciation and amortization), which we met by a significant margin
as of December 31, 2006. Our ability to comply with this financial
covenant in the future does not depend on further debt reduction
or on improved operating results.
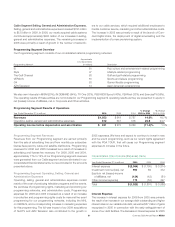
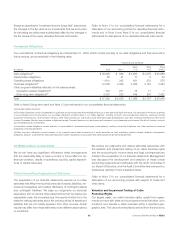
Share Repurchase Program
As of December 31, 2006, the maximum dollar value of shares
remaining that may be repurchased under our Board-authorized
share repurchase program was approximately $3 billion. We expect
such repurchases to continue from time to time in the open market
or in private transactions, subject to market conditions.
SHARE REPURCHASES
(in billions)
$1.4
$2.3 $2.3
200620052004
Investing Activities
Net cash used in investing activities was $9.872 billion for 2006
and consists principally of cash paid for acquisitions of $5.110
billion (primarily related to the Adelphia transaction, Susquehanna
Communications acquisition and the acquisition of our additional
interest in E! Entertainment Television), capital expenditures of
$4.395 billion, and investments of $2.812 billion (primarily related
to our interest in SpectrumCo and the additional funding related
to the dissolution of TKCCP). These cash outflows were partially
offset by proceeds from sales, settlements and restructuring of
investments of $2.720 billion (primarily related to our disposition of
our ownership interest in TWE and TWC).
Refer to Notes 5, 6 and 7 to our consolidated financial statements
for a discussion of our acquisitions and other significant events,
investments, and our intangible assets, respectively.
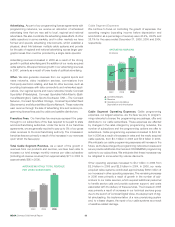
Capital Expenditures
Our most significant recurring investing activity has been capital
expenditures, and we expect that this will continue in the future.
The following chart illustrates the capital expenditures we incurred
in our Cable segment from 2004 through 2006:
CABLE CAPITAL EXPENDITURES
(in billions)
$1.9
$3.4
$2.5
$3.4
$3.2
$4.2
$0.9
$0.3 $0.3
$0.6 $0.6 $0.7
200620052004
New service offerings
Upgrading of cable systems
Recurring capital projects
In 2006, approximately 75% of Cable capital expenditures were
variable and directly associated with continued and growing
demand for our existing and new products and services, which
leads to increases in RGUs. The amounts of capital expenditures
in our Programming segment and our other business activities
have not been significant and have been relatively stable from
2004 through 2006. The amounts of our capital expenditures for
2007 and for subsequent years will depend on numerous factors,
including acquisitions, competition, changes in technology and the
timing and rate of deployment of new services.
■
■
■