Comcast 2006 Annual Report Download - page 36
Download and view the complete annual report
Please find page 36 of the 2006 Comcast annual report below. You can navigate through the pages in the report by either clicking on the pages listed below, or by using the keyword search tool below to find specific information within the annual report.-
 1
1 -
2
-
3
-
4
-
5
-
6
-
7
-
8
-
9
-
10
-
11
-
12
-
13
-
14
-
15
-
16
-
17
-
18
-
19
-
20
-
21
-
22
-
23
-
24
-
25
-
 26
26 -
 27
27 -
 28
28 -
 29
29 -
 30
30 -
 31
31 -
 32
32 -
 33
33 -
 34
34 -
 35
35 -
 36
36 -
 37
37 -
 38
38 -
 39
39 -
 40
40 -
 41
41 -
 42
42 -
 43
43 -
 44
44 -
 45
45 -
 46
46 -
47
-
48
-
49
-
50
-
51
-
52
-
53
-
54
-
55
-
56
-
57
-
58
-
59
-
60
-
61
-
62
-
63
-
64
-
65
-
66
-
67
-
68
-
69
-
70
-
71
-
72
-
73
-
74
-
75
-
76
-
77
-
78
-
79
-
80
-
81
-
82
-
83
-
84
 |
 |

MD&A Comcast 2006 Annual Report 34
We use the notional amounts on the instruments to calculate the
interest to be paid or received. The notional amounts do not repre-
sent the amount of our exposure to credit loss. The estimated fair
value approximates the payments necessary to settle the outstand-
ing contracts. We estimate interest rates on variable debt using the
average implied forward London Interbank Offered Rate (“LIBOR”)
rates for the year of maturity based on the yield curve in effect
on December 31, 2006, plus the applicable margin in effect on
December 31, 2006. We estimate the floating rates on our swaps
using the average implied forward LIBOR for the year of maturity
based on the yield curve in effect on December 31, 2006.
As a matter of practice, we typically do not structure our financial
contracts to include credit-ratings-based triggers that could affect
our liquidity. In the ordinary course of business, some of our swaps
could be subject to termination provisions if we do not maintain
investment grade credit ratings. As of December 31, 2006, and
2005, the estimated fair value of those swaps was a liability of
$60 million and $69 million, respectively. The amount to be paid
or received upon termination, if any, would be based upon the fair
value of those outstanding contracts at that time.
Equity Price Risk Management
We are exposed to the market risk of changes in the equity prices
of our investments in marketable securities. We enter into various
derivative transactions pursuant to our policies to manage the vola-
tility relating to these exposures.
Through market value and sensitivity analyses, we monitor our
equity price risk exposures to ensure that the instruments are
matched with the underlying assets or liabilities, reduce our risks
relating to equity prices and maintain a high correlation to the risk
inherent in the hedged item.
To limit our exposure to and benefits from price fluctuations in the
common stock of some of our investments, we use equity deriva-
tive financial instruments. These derivative financial instruments
include equity collar agreements, prepaid forward sales agree-
ments and indexed or exchangeable debt instruments and are
accounted for at fair value.
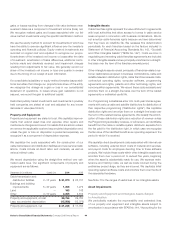
The table set forth below summarizes the fair values and contract terms of financial instruments subject to interest rate risk maintained by
us as of December 31, 2006:
Fair Value
(in millions) 2007 2008 2009 2010 2011 Thereafter Total 12/31/06
Debt
Fixed-Rate $ 908 $ 1,474 $ 990 $ 1,109 $ 1,741 $ 20,982 $ 27,204 $ 28,923
Average Interest Rate 8.3% 7.3% 7.5% 5.7% 6.4% 7.2% 7.2%
Variable-Rate $ 75 $ 194 $ 1,259 $ 211 $ 26 $ 6 $ 1,771 $ 1,771
Average Interest Rate 5.8% 5.5% 5.3% 5.1% 5.9% 6.8% 5.3%
Interest Rate Instruments(a)
Fixed to Variable Swaps $ — $ 600 $ 750 $ 200 $ 750 $ 900 $ 3,200 $ (103)
Average Pay Rate —% 7.2% 7.0% 6.1% 6.1% 5.4% 6.3%
Average Receive Rate —% 6.2% 6.9% 5.9% 5.5% 5.3% 5.9%
(a) We did not have any variable to fixed swaps as of December 31, 2006.
Interest Rate Risk Management
We maintain a mix of fixed and variable-rate debt. Approximately
94% of our total debt of $28.975 billion is at fixed rates with the
remaining at variable rates. We are exposed to the market risk of
adverse changes in interest rates. In order to manage the cost and
volatility relating to the interest cost of our outstanding debt, we
enter into various interest rate risk management derivative transac-
tions pursuant to our policies.
We monitor our interest rate risk exposures using techniques that
include market value and sensitivity analyses. We do not hold or
issue any derivative financial instruments for speculative purposes
and we are not a party to any leveraged derivative instruments.
We manage the credit risks associated with our derivative financial
instruments through the evaluation and monitoring of the credit-
worthiness of the counterparties. Although we may be exposed to
losses in the event of nonperformance by the counterparties, we
do not expect such losses, if any, to be significant.
Our interest rate derivative financial instruments, which can include
swaps, rate locks, caps and collars, represent an integral part of our
interest rate risk management program. Our interest rate derivative
financial instruments reduced the portion of our total debt at fixed-
rates from 94% to 83% as of December 31, 2006. The effect of our
interest rate derivative financial instruments increased our interest
expense by approximately $39 million in 2006, and decreased our
interest expense by approximately $16 million and $66 million in 2005
and 2004, respectively. Interest rate risk management instruments
may have a significant effect on our interest expense in the future.