Comcast 2006 Annual Report Download - page 68
Download and view the complete annual report
Please find page 68 of the 2006 Comcast annual report below. You can navigate through the pages in the report by either clicking on the pages listed below, or by using the keyword search tool below to find specific information within the annual report.-
 1
1 -
2
-
3
-
4
-
5
-
6
-
7
-
8
-
9
-
10
-
11
-
12
-
13
-
14
-
15
-
16
-
17
-
18
-
19
-
20
-
21
-
22
-
23
-
24
-
25
-
26
-
27
-
28
-
29
-
30
-
31
-
32
-
33
-
34
-
35
-
36
-
37
-
38
-
39
-
40
-
41
-
42
-
43
-
44
-
45
-
46
-
47
-
48
-
49
-
50
-
51
-
52
-
53
-
54
-
55
-
56
-
57
-
 58
58 -
 59
59 -
 60
60 -
 61
61 -
 62
62 -
 63
63 -
 64
64 -
 65
65 -
 66
66 -
 67
67 -
 68
68 -
 69
69 -
 70
70 -
 71
71 -
 72
72 -
 73
73 -
 74
74 -
 75
75 -
 76
76 -
 77
77 -
 78
78 -
79
-
80
-
81
-
82
-
83
-
84
 |
 |

Notes to Consolidated Financial Statements Comcast 2006 Annual Report 66
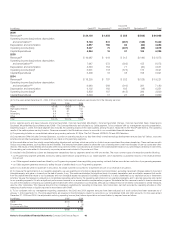
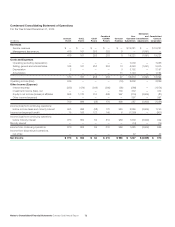
Corporate
(in millions) Cable(a)(b) Programming(c) and Other(d)(e) Eliminations(e)(f) Total
2006
Revenues(g) $ 24,100 $ 1,053 $ 355 $ (542) $ 24,966
Operating income (loss) before depreciation
and amortization(h) 9,704 241 (357) (146) 9,442
Depreciation and amortization 4,657 166 80 (80) 4,823
Operating income (loss) 5,047 75 (437) (66) 4,619
Capital Expenditures 4,244 16 31 104 4,395
2005
Revenues(g) $ 19,987 $ 919 $ 315 $ (146) $ 21,075
Operating income (loss) before depreciation
and amortization(h)(i) 7,947 272 (302) 155 8,072
Depreciation and amortization 4,346 154 71 (20) 4,551
Operating income (loss)(i) 3,601 118 (373) 175 3,521
Capital Expenditures 3,409 16 38 158 3,621
2004
Revenues(g) $ 18,230 $ 787 $ 332 $ (128) $ 19,221
Operating income (loss) before depreciation
and amortization(h)(i) 6,940 269 (310) 281 7,180
Depreciation and amortization 4,102 162 105 (18) 4,351
Operating income (loss)(i) 2,838 107 (415) 299 2,829
Capital Expenditures 3,394 17 21 228 3,660
(a) For the years ended December 31, 2006, 2005 and 2004, Cable segment revenues were derived from the following services:
2006 2005 2004
Video 62.6% 64.6% 67.0%
High-speed Internet 20.7 18.8 16.1
Phone 3.8 3.1 3.4
Advertising 6.4 6.4 6.6
Other 6.5 7.1 6.9
Total 100.0% 100.0% 100.0%
(b) Our regional sports and news networks (Comcast SportsNet, Comcast SportsNet Mid-Atlantic, Comcast SportsNet Chicago, Comcast SportsNet West, Cable Sports
Southeast, MountainWest Sports Network and CN8 — The Comcast Network) are included in our Cable segment. To be consistent with our management reporting presentation,
beginning August 1, 2006, the Cable segment also includes the operating results of the cable systems serving Houston, Texas held in the TKCCP (see Note 5). The operating
results of the cable systems serving Houston, Texas are reversed in the Eliminations column to reconcile to our consolidated financial statements.
(c) Programming includes our consolidated national programming networks: E!, Style, The Golf Channel, VERSUS, G4 and AZN Television.
(d) Corporate and Other includes Comcast Spectacor, a portion of operating results of our less than wholly owned technology development ventures (see “(e)” below), corporate
activities and all other businesses not presented in our Cable or Programming segments.
(e) We consolidate our less than wholly owned technology development ventures, which we control or of which we are considered the primary beneficiary. These ventures are with
various corporate partners, such as Motorola and Gemstar. The ventures have been created to share the costs of development of new technologies for set-top boxes and other
devices. The results of these entities are included within Corporate and Other. Cost allocations are made to the Cable segment based on our percentage ownership in each entity.
The remaining net costs related to the minority corporate partners are included in Corporate and Other.
(f) Included in the Eliminations column are intersegment transactions that our segments enter into with one another. The most common types of transactions are the following:
• our Programming segment generates revenue by selling cable network programming to our Cable segment, which represents a substantial majority of the revenue elimina-
tion amount
• our Cable segment receives incentives offered by our Programming segment when negotiating programming contracts that are recorded as a reduction of programming expenses
• our Cable segment generates revenue by selling the use of satellite feeds to our Programming segment
(g) Non-U.S. revenues were not significant in any period. No single customer accounted for a significant amount of our revenue in any period.
(h) To measure the performance of our operating segments, we use operating income before depreciation and amortization, excluding impairment charges related to fixed and
intangible assets, and gains or losses from the sale of assets, if any. This measure eliminates the significant level of noncash depreciation and amortization expense that results
from the capital-intensive nature of our businesses and from intangible assets recognized in business combinations. It is also unaffected by our capital structure or investment
activities. We use this measure to evaluate our consolidated operating performance, the operating performance of our operating segments, and to allocate resources and capital
to our operating segments. It is also a significant performance measure in our annual incentive compensation programs. We believe that this measure is useful to investors because
it is one of the bases for comparing our operating performance with other companies in our industries, although our measure may not be directly comparable to similar measures
used by other companies. This measure should not be considered a substitute for operating income (loss), net income (loss), net cash provided by operating activities or other
measures of performance or liquidity reported in accordance with GAAP.
(i) To be consistent with our management reporting presentation, the 2005 and 2004 segment amounts have been adjusted as if stock options had been expensed as of
January 1, 2004 (see Note 10). The total adjustments are reversed in the Eliminations column to reconcile to our consolidated 2005 and 2004 amounts. For the years ended
December 31, 2005 and 2004, the adjustments reducing operating income (loss) before depreciation and amortization by segment were as follows:
(in millions) 2005 2004
Cable $ 116 $ 180
Programming 1 (4)
Corporate and Other 49 107
Total $ 166 $ 283