Comcast 2006 Annual Report Download - page 33
Download and view the complete annual report
Please find page 33 of the 2006 Comcast annual report below. You can navigate through the pages in the report by either clicking on the pages listed below, or by using the keyword search tool below to find specific information within the annual report.-
 1
1 -
2
-
3
-
4
-
5
-
6
-
7
-
8
-
9
-
10
-
11
-
12
-
13
-
14
-
15
-
16
-
17
-
18
-
19
-
20
-
21
-
22
-
 23
23 -
 24
24 -
 25
25 -
 26
26 -
 27
27 -
 28
28 -
 29
29 -
 30
30 -
 31
31 -
 32
32 -
 33
33 -
 34
34 -
 35
35 -
 36
36 -
 37
37 -
 38
38 -
 39
39 -
 40
40 -
 41
41 -
 42
42 -
 43
43 -
44
-
45
-
46
-
47
-
48
-
49
-
50
-
51
-
52
-
53
-
54
-
55
-
56
-
57
-
58
-
59
-
60
-
61
-
62
-
63
-
64
-
65
-
66
-
67
-
68
-
69
-
70
-
71
-
72
-
73
-
74
-
75
-
76
-
77
-
78
-
79
-
80
-
81
-
82
-
83
-
84
 |
 |

31 Comcast 2006 Annual Report MD&A
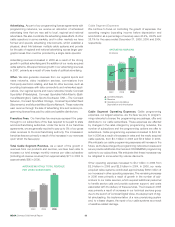
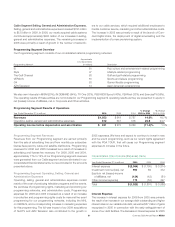
Cable Segment Selling, General and Administrative Expenses.
Selling, general and administrative expenses increased $797 million
to $5.8 billion in 2006. In 2006, our newly acquired cable systems
contributed approximately $400 million of our increases in selling,
general and administrative expenses. The remaining increases in
2006 were primarily a result of growth in the number of subscrib-
ers to our cable services, which required additional employees to
handle customer service, marketing and other administrative costs.
The increase in 2005 was primarily a result of the launch of Com-
cast Digital Voice, the deployment of digital simulcasting and the
implementation of a new provisioning system.
Programming Segment Overview
Our Programming segment consists of our consolidated national programming networks:
Approximate
U.S. Subscribers
Programming Network (in millions) Description
E! 81 Pop culture and entertainment-related programming
Style 37 Lifestyle-related programming
The Golf Channel 63 Golf and golf-related programming
VERSUS 61 Sports and leisure programming
G4 53 Gamer lifestyle programming
AZN Television 14 Asian American programming
We also own interests in MGM (20%), iN DEMAND (54%), TV One (33%), PBS KIDS Sprout (40%), FEARnet (33%) and ExerciseTV (55%).
The operating results of these entities are not included in our Programming segment’s operating results as they are presented in equity in
net (losses) income of affiliates, net or Corporate and Other activities.
Programming Segment Results of Operations
% Change % Change
Year Ended December 31 (in millions) 2006 2005 2004 2005 to 2006 2004 to 2005
Revenues $ 1,053 $ 919 $ 787 14.6% 16.7%
Operating, selling, general and administrative expenses 812 647 518 25.6 24.7
Operating income before depreciation and amortization $ 241 $ 272 $ 269 (11.4)% 1.3%
Programming Segment Revenues
Revenues from our Programming segment are earned primarily
from the sale of advertising time and from monthly per subscriber
license fees paid by cable and satellite distributors. Programming
revenues for 2006 and 2005 increased as a result of increases in
advertising and license fee revenues. For 2006, 2005 and 2004,
approximately 11% to 12% of our Programming segment revenues
were generated from our Cable segment and are eliminated in our
consolidated financial statements, but are included in the amounts
presented above.
Programming Segment Operating, Selling, General and
Administrative Expenses
Operating, selling, general and administrative expenses consist
mainly of the cost of producing television programs and live events,
the purchase of programming rights, marketing and promoting our
programming networks, and administrative costs. Programming
expenses for 2006 and 2005 increased as a result of an increase
in production and programming rights costs for new and live event
programming for our programming networks, including the NHL
on VERSUS, and a corresponding increase in marketing expenses
for this programming. The full-year impact of our 2004 acquisitions
of TechTV and AZN Television also contributed to the growth in
2005 expenses. We have and expect to continue to invest in new
and live event programming, such as our recent rights agreement
with the PGA TOUR, that will cause our Programming segment
expenses to increase in the future.
Consolidated Other Income (Expense) Items
Year Ended December 31 (in millions) 2006 2005 2004
Interest expense $ (2,064) $ (1,795) $ (1,874)
Investment income (loss), net 990 89 472
Equity in net (losses) income
of affiliates, net (124) (42) (81)
Other income (expense) 173 (53) 397
Total $ (1,025) $ (1,801) $ (1,086)
Interest Expense
The increase in interest expense for 2006 from 2005 was primarily
the result of an increase in our average debt outstanding and higher
interest rates on our variable-rate debt, as well as $57 million of gains
recognized in 2005 in connection with the early extinguishment of
some of our debt facilities. The decrease in interest expense for 2005