Cigna 2009 Annual Report Download - page 94
Download and view the complete annual report
Please find page 94 of the 2009 Cigna annual report below. You can navigate through the pages in the report by either clicking on the pages listed below, or by using the keyword search tool below to find specific information within the annual report.-
 1
1 -
2
-
3
-
4
-
5
-
6
-
7
-
8
-
9
-
10
-
11
-
12
-
13
-
14
-
15
-
16
-
17
-
18
-
19
-
20
-
21
-
22
-
23
-
24
-
25
-
26
-
27
-
28
-
29
-
30
-
31
-
32
-
33
-
34
-
35
-
36
-
37
-
38
-
39
-
40
-
41
-
42
-
43
-
44
-
45
-
46
-
47
-
48
-
49
-
50
-
51
-
52
-
53
-
54
-
55
-
56
-
57
-
58
-
59
-
60
-
61
-
62
-
63
-
64
-
65
-
66
-
67
-
68
-
69
-
70
-
71
-
72
-
73
-
74
-
75
-
76
-
77
-
78
-
79
-
80
-
81
-
82
-
83
-
 84
84 -
 85
85 -
 86
86 -
 87
87 -
 88
88 -
 89
89 -
 90
90 -
 91
91 -
 92
92 -
 93
93 -
 94
94 -
 95
95 -
 96
96 -
 97
97 -
 98
98 -
 99
99 -
 100
100 -
 101
101 -
 102
102 -
 103
103 -
 104
104 -
105
-
106
-
107
-
108
-
109
-
110
-
111
-
112
-
113
-
114
-
115
-
116
-
117
-
118
-
119
-
120
-
121
-
122
-
123
-
124
-
125
-
126
-
127
-
128
-
129
-
130
-
131
-
132
-
133
-
134
-
135
-
136
-
137
-
138
-
139
-
140
-
141
-
142
-
143
-
144
-
145
-
146
-
147
-
148
-
149
-
150
-
151
-
152
-
153
-
154
-
155
-
156
-
157
-
158
-
159
-
160
-
161
-
162
-
163
-
164
-
165
-
166
-
167
-
168
-
169
-
170
-
171
-
172
-
173
-
174
-
175
-
176
-
177
-
178
-
179
-
180
-
181
-
182
-
183
-
184
-
185
-
186
-
187
-
188
-
189
-
190
-
191
-
192
-
193
-
194
-
195
-
196
-
197
-
198
-
199
-
200
-
201
-
202
-
203
-
204
-
205
-
206
-
207
-
208
-
209
-
210
-
211
-
212
-
213
-
214
-
215
-
216
-
217
-
218
-
219
-
220
-
221
-
222
-
223
-
224
-
225
-
226
-
227
-
228
 |
 |

74
Overview of 2008 Results
Segment loss for 2008 reflected significant losses from the GMIB business of $437 million, including a charge of $131 million related
to the implementation of new fair value accounting guidance in 2008. Excluding this charge, GMIB losses in 2008 primarily reflected
the declines in equity market and interest rates and increased market volatility.
In addition, adjusted loss from operations for Run-off Reinsurance was significantly higher in 2008 primarily reflecting a loss in the
GMDB business of $267 million after-tax primarily reflecting reserve strengthening. This loss was primarily related to declines in
equity markets and interest rates and increased market volatility. Adjusted loss from operations for Run-off Reinsurance in 2008
compared with 2007 was also negatively impacted by reduced favorable settlement activity related to personal accident and workers’
compensation.
See the Benefits and Expenses section for further discussion around the results of the GMIB and GMDB businesses.
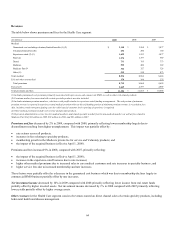
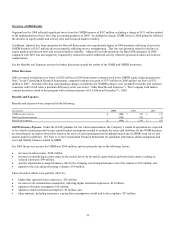
Other Revenues
Other revenues included pre-tax losses of $282 million in 2009 from futures contracts used in the GMDB equity hedge program (see
Note 7 to the Consolidated Financial Statements), compared with pre-tax gains of $333 million in 2008 and pre-tax losses of $32
million in 2007. Amounts reflecting corresponding changes in liabilities for GMDB contracts were included in benefits and expenses
consistent with GAAP when a premium deficiency exists (see below “Other Benefits and Expenses”). The Company held futures
contract positions related to this program with a notional amount of $1.0 billion at December 31, 2009.
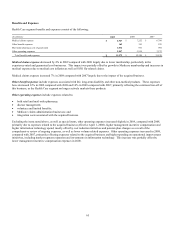
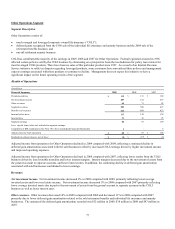
Benefits and Expenses
Benefits and expenses were comprised of the following:
(In millions) 2009 2008 2007
GMIB (income) expense $(304) $ 690 $ 147
Other benefits and expenses (115) 809 13
Benefits and expenses $(419) $ 1,499 $ 160
GMIB (Income) Expense. Under the GAAP guidance for fair value measurements, the Company’s results of operations are expected
to be volatile in future periods because capital market assumptions needed to estimate the assets and liabilities for the GMIB business
are based largely on market-observable inputs at the close of each reporting period including interest rates (LIBOR swap curve) and
market-implied volatilities. See Note 11 to the Consolidated Financial Statements for additional information about assumptions and
asset and liability balances related to GMIB.
For 2009 the pre-tax income for GMIB was $304 million, and was primarily due to the following factors:
x increases in interest rates: $248 million;
x increases in underlying account values in the period, driven by favorable equity market and bond fund returns, resulting in
reduced exposures: $98 million;
x specific adjustments to nonperformance risk for the Company net of nonperformance risk of its reinsurers: $16 million; and
x updates to the risk and profit charge estimates: $30 million.
These favorable effects were partially offset by:
x higher than expected claim experience: $26 million;
x increases to the annuitization assumption, reflecting higher utilization experience: $21 million;
x updates to the lapse assumption: $14 million;
x updates to fund correlation assumptions: $4 million; and
x other amounts, including experience varying from assumptions, model and in-force updates: $23 million.