Cigna 2009 Annual Report Download - page 160
Download and view the complete annual report
Please find page 160 of the 2009 Cigna annual report below. You can navigate through the pages in the report by either clicking on the pages listed below, or by using the keyword search tool below to find specific information within the annual report.-
 1
1 -
2
-
3
-
4
-
5
-
6
-
7
-
8
-
9
-
10
-
11
-
12
-
13
-
14
-
15
-
16
-
17
-
18
-
19
-
20
-
21
-
22
-
23
-
24
-
25
-
26
-
27
-
28
-
29
-
30
-
31
-
32
-
33
-
34
-
35
-
36
-
37
-
38
-
39
-
40
-
41
-
42
-
43
-
44
-
45
-
46
-
47
-
48
-
49
-
50
-
51
-
52
-
53
-
54
-
55
-
56
-
57
-
58
-
59
-
60
-
61
-
62
-
63
-
64
-
65
-
66
-
67
-
68
-
69
-
70
-
71
-
72
-
73
-
74
-
75
-
76
-
77
-
78
-
79
-
80
-
81
-
82
-
83
-
84
-
85
-
86
-
87
-
88
-
89
-
90
-
91
-
92
-
93
-
94
-
95
-
96
-
97
-
98
-
99
-
100
-
101
-
102
-
103
-
104
-
105
-
106
-
107
-
108
-
109
-
110
-
111
-
112
-
113
-
114
-
115
-
116
-
117
-
118
-
119
-
120
-
121
-
122
-
123
-
124
-
125
-
126
-
127
-
128
-
129
-
130
-
131
-
132
-
133
-
134
-
135
-
136
-
137
-
138
-
139
-
140
-
141
-
142
-
143
-
144
-
145
-
146
-
147
-
148
-
149
-
 150
150 -
 151
151 -
 152
152 -
 153
153 -
 154
154 -
 155
155 -
 156
156 -
 157
157 -
 158
158 -
 159
159 -
 160
160 -
 161
161 -
 162
162 -
 163
163 -
 164
164 -
 165
165 -
 166
166 -
 167
167 -
 168
168 -
 169
169 -
 170
170 -
171
-
172
-
173
-
174
-
175
-
176
-
177
-
178
-
179
-
180
-
181
-
182
-
183
-
184
-
185
-
186
-
187
-
188
-
189
-
190
-
191
-
192
-
193
-
194
-
195
-
196
-
197
-
198
-
199
-
200
-
201
-
202
-
203
-
204
-
205
-
206
-
207
-
208
-
209
-
210
-
211
-
212
-
213
-
214
-
215
-
216
-
217
-
218
-
219
-
220
-
221
-
222
-
223
-
224
-
225
-
226
-
227
-
228
 |
 |

140
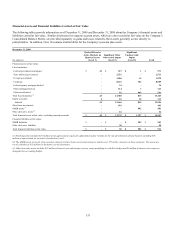
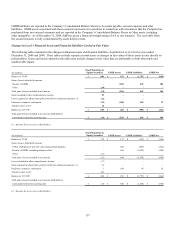
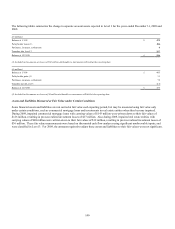
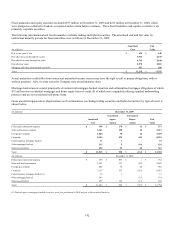
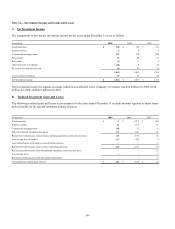
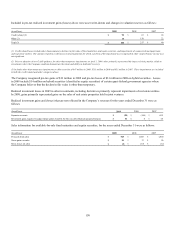
The following tables summarize the change in separate account assets reported in Level 3 for the years ended December 31, 2009 and
2008.
(In millions)
Balance at 1/1/09 $ 475
Policyholder losses (1) (86)
Purchases, issuances, settlements 4
Transfers into Level 3 157
Balance at 12/31/09 $ 550
(1) Included in this amount are losses of $92 million attributable to instruments still held at the reporting date.
(In millions)
Balance at 1/1/08 $ 403
Policyholder gains (1) 11
Purchases, issuances, settlements 78
Transfers out of Level 3 (17)
Balance at 12/31/08 $ 475
(1) Included in this amount are losses of $4 million attributable to instruments still held at the reporting date.
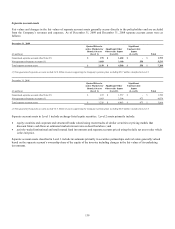
Assets and Liabilities Measured at Fair Value under Certain Conditions
Some financial assets and liabilities are not carried at fair value each reporting period, but may be measured using fair value only
under certain conditions, such as commercial mortgage loans and investments in real estate entities when they become impaired.
During 2009, impaired commercial mortgage loans with carrying values of $143 million were written down to their fair values of
$126 million, resulting in pre-tax realized investment losses of $17 million. Also during 2009, impaired real estate entities with
carrying values of $48 million were written down to their fair values of $12 million, resulting in pre-tax realized investment losses of
$36 million. These fair value measurements were based on discounted cash flow analyses using significant unobservable inputs, and
were classified in Level 3. For 2008, the amounts required to adjust these assets and liabilities to their fair values were not significant.