Cigna 2009 Annual Report Download - page 101
Download and view the complete annual report
Please find page 101 of the 2009 Cigna annual report below. You can navigate through the pages in the report by either clicking on the pages listed below, or by using the keyword search tool below to find specific information within the annual report.-
 1
1 -
2
-
3
-
4
-
5
-
6
-
7
-
8
-
9
-
10
-
11
-
12
-
13
-
14
-
15
-
16
-
17
-
18
-
19
-
20
-
21
-
22
-
23
-
24
-
25
-
26
-
27
-
28
-
29
-
30
-
31
-
32
-
33
-
34
-
35
-
36
-
37
-
38
-
39
-
40
-
41
-
42
-
43
-
44
-
45
-
46
-
47
-
48
-
49
-
50
-
51
-
52
-
53
-
54
-
55
-
56
-
57
-
58
-
59
-
60
-
61
-
62
-
63
-
64
-
65
-
66
-
67
-
68
-
69
-
70
-
71
-
72
-
73
-
74
-
75
-
76
-
77
-
78
-
79
-
80
-
81
-
82
-
83
-
84
-
85
-
86
-
87
-
88
-
89
-
90
-
 91
91 -
 92
92 -
 93
93 -
 94
94 -
 95
95 -
 96
96 -
 97
97 -
 98
98 -
 99
99 -
 100
100 -
 101
101 -
 102
102 -
 103
103 -
 104
104 -
 105
105 -
 106
106 -
 107
107 -
 108
108 -
 109
109 -
 110
110 -
 111
111 -
112
-
113
-
114
-
115
-
116
-
117
-
118
-
119
-
120
-
121
-
122
-
123
-
124
-
125
-
126
-
127
-
128
-
129
-
130
-
131
-
132
-
133
-
134
-
135
-
136
-
137
-
138
-
139
-
140
-
141
-
142
-
143
-
144
-
145
-
146
-
147
-
148
-
149
-
150
-
151
-
152
-
153
-
154
-
155
-
156
-
157
-
158
-
159
-
160
-
161
-
162
-
163
-
164
-
165
-
166
-
167
-
168
-
169
-
170
-
171
-
172
-
173
-
174
-
175
-
176
-
177
-
178
-
179
-
180
-
181
-
182
-
183
-
184
-
185
-
186
-
187
-
188
-
189
-
190
-
191
-
192
-
193
-
194
-
195
-
196
-
197
-
198
-
199
-
200
-
201
-
202
-
203
-
204
-
205
-
206
-
207
-
208
-
209
-
210
-
211
-
212
-
213
-
214
-
215
-
216
-
217
-
218
-
219
-
220
-
221
-
222
-
223
-
224
-
225
-
226
-
227
-
228
 |
 |

81
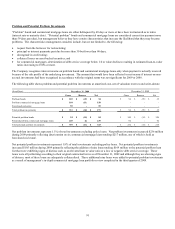
Cash flows from investing activities generally consist of net investment purchases or sales and net purchases of property and
equipment, which includes capitalized software, as well as cash used to acquire businesses.
Cash flows from financing activities are generally comprised of issuances and re-payment of debt at the parent level, proceeds on the
issuance of common stock resulting from stock option exercises, and stock repurchases. In addition, the subsidiaries report net
deposits/withdrawals to/from investment contract liabilities (which include universal life insurance liabilities) because such liabilities
are considered financing activities with policyholders.
2009:
Operating activities
For the year ended December 31, 2009, cash flows from operating activities were less than net income by $560 million. Net income
contains certain after-tax non-cash income and expense items, including:
x GMIB income of $209 million;
x a curtailment gain of $30 million, net of a cost reduction charge of $29 million;
x tax benefits related to the IRS examination of $20 million;
x depreciation and amortization charges of $174 million; and
x realized investment losses of $26 million.
Cash flows from operating activities were lower than net income excluding the non-cash items noted above by $530 million. This
decrease was primarily due to pre-tax cash outflows of $282 million associated with the GMDB equity hedge program which did not
affect shareholders’ net income and pre-tax contributions to the domestic pension plans of approximately $410 million, partially offset
by the favorable effect of the pension contributions on tax payments.
Cash flows from operating activities decreased by $911 million in 2009 compared with 2008. Excluding the results of the GMDB
equity hedge program (which did not affect net income), cash flows from operating activities decreased by $296 million. This
decrease in 2009 primarily reflects pre-tax contributions to the qualified domestic pension plan of approximately $410 million for
2009 compared with none for 2008, partially offset by the favorable effect of the pension contributions on tax payments.
Investing activities
Cash used in investing activities was $1.5 billion. This use of cash primarily consisted of net purchases of investments of $1.2 billion
and net purchases of property and equipment of $307 million.
Financing activities
Cash provided from financing activities primarily consisted of net proceeds from the issuance of long-term debt of $346 million,
partially offset by repayments of short-term debt, principally commercial paper, of $199 million. Financing activities also included
net deposits to contractholder deposit funds of $89 million and proceeds on issuances of common stock of $30 million.