Cigna 2009 Annual Report Download - page 156
Download and view the complete annual report
Please find page 156 of the 2009 Cigna annual report below. You can navigate through the pages in the report by either clicking on the pages listed below, or by using the keyword search tool below to find specific information within the annual report.-
 1
1 -
2
-
3
-
4
-
5
-
6
-
7
-
8
-
9
-
10
-
11
-
12
-
13
-
14
-
15
-
16
-
17
-
18
-
19
-
20
-
21
-
22
-
23
-
24
-
25
-
26
-
27
-
28
-
29
-
30
-
31
-
32
-
33
-
34
-
35
-
36
-
37
-
38
-
39
-
40
-
41
-
42
-
43
-
44
-
45
-
46
-
47
-
48
-
49
-
50
-
51
-
52
-
53
-
54
-
55
-
56
-
57
-
58
-
59
-
60
-
61
-
62
-
63
-
64
-
65
-
66
-
67
-
68
-
69
-
70
-
71
-
72
-
73
-
74
-
75
-
76
-
77
-
78
-
79
-
80
-
81
-
82
-
83
-
84
-
85
-
86
-
87
-
88
-
89
-
90
-
91
-
92
-
93
-
94
-
95
-
96
-
97
-
98
-
99
-
100
-
101
-
102
-
103
-
104
-
105
-
106
-
107
-
108
-
109
-
110
-
111
-
112
-
113
-
114
-
115
-
116
-
117
-
118
-
119
-
120
-
121
-
122
-
123
-
124
-
125
-
126
-
127
-
128
-
129
-
130
-
131
-
132
-
133
-
134
-
135
-
136
-
137
-
138
-
139
-
140
-
141
-
142
-
143
-
144
-
145
-
 146
146 -
 147
147 -
 148
148 -
 149
149 -
 150
150 -
 151
151 -
 152
152 -
 153
153 -
 154
154 -
 155
155 -
 156
156 -
 157
157 -
 158
158 -
 159
159 -
 160
160 -
 161
161 -
 162
162 -
 163
163 -
 164
164 -
 165
165 -
 166
166 -
167
-
168
-
169
-
170
-
171
-
172
-
173
-
174
-
175
-
176
-
177
-
178
-
179
-
180
-
181
-
182
-
183
-
184
-
185
-
186
-
187
-
188
-
189
-
190
-
191
-
192
-
193
-
194
-
195
-
196
-
197
-
198
-
199
-
200
-
201
-
202
-
203
-
204
-
205
-
206
-
207
-
208
-
209
-
210
-
211
-
212
-
213
-
214
-
215
-
216
-
217
-
218
-
219
-
220
-
221
-
222
-
223
-
224
-
225
-
226
-
227
-
228
 |
 |
136
These GMIB assets and liabilities are estimated with a complex internal model using many scenarios to determine the present value of
net amounts expected to be paid, less the present value of net future premiums expected to be received adjusted for risk and profit
charges that the Company estimates a hypothetical market participant would require to assume this business. Net amounts expected to
be paid include the excess of the expected value of the income benefits over the values of the annuitants’ accounts at the time of
annuitization. Generally, market return, interest rate and volatility assumptions are based on market observable
information. Assumptions related to annuitant behavior reflect the Company’s belief that a hypothetical market participant would
consider the actual and expected experience of the Company as well as other relevant and available industry resources in setting
policyholder behavior assumptions. The Company is also required to adjust for nonperformance risk to reflect the market’s perception
of the risk that either the Company will not fulfill its GMIB liability (own credit) or the Company will not collect on its GMIB
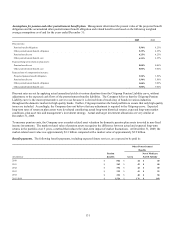
retrocessional coverage (reinsurer credit risk). The significant assumptions used to value the GMIB assets and liabilities as of
December 31, 2009 were as follows:
x The market return and discount rate assumptions are based on the market-observable LIBOR swap curve.
x The projected interest rate used to calculate the reinsured income benefits is indexed to the 7-year Treasury Rate at the time of
annuitization (claim interest rate) based on contractual terms. That rate was 3.39% at December 31, 2009 and must be projected
for future time periods. These projected rates vary by economic scenario and are determined by an interest rate model using
current interest rate curves and the prices of instruments available in the market including various interest rate caps and zero-
coupon bonds. For a subset of the business, there is a contractually guaranteed floor of 3% for the claim interest rate.
x The market volatility assumptions for annuitants’ underlying mutual fund investments that are modeled based on the S&P 500,
Russell 2000 and NASDAQ Composite are based on the market-implied volatility for these indices for three to seven years
grading to historical volatility levels thereafter. For the remaining 56% of underlying mutual fund investments modeled based on
other indices (with insufficient market-observable data), volatility is based on the average historical level for each index over the
past 10 years. Using this approach, volatility ranges from 17% to 33% for equity funds, 4% to 12% for bond funds and 1% to 2%
for money market funds.
x The mortality assumption is 70% of the 1994 Group Annuity Mortality table, with 1% annual improvement beginning January 1,
2000.
x The annual lapse rate assumption reflects experience that differs by the company issuing the underlying variable annuity
contracts, ranges from 2% to 17% and depends on the time since contract issue and the relative value of the guarantee.
x The annual annuity election rate assumption reflects experience that differs by the company issuing the underlying variable
annuity contracts and depends on the annuitant’s age, the relative value of the guarantee and whether a contractholder has had a
previous opportunity to elect the benefit. Immediately after the expiration of the waiting period, the assumed probability that an
individual will annuitize their variable annuity contract is up to 80%. For the second and subsequent annual opportunities to elect
the benefit, the assumed probability of election is up to 30%. Actual data is still emerging for the Company as well as the
industry and the estimates are based on this limited data.
x The nonperformance risk adjustment is incorporated by adding an additional spread to the discount rate in the calculation of both
(1) the GMIB liability to reflect a hypothetical market participant’s view of the risk of the Company not fulfilling its GMIB
obligations, and (2) the GMIB asset to reflect a hypothetical market participant’s view of the reinsurers’ credit risk, after
considering collateral. The estimated market-implied spread is company-specific for each party involved to the extent that
company-specific market data is available and based on industry averages for similarly rated companies when company-specific
data is not available. The spread is impacted by the credit default swap (“CDS”) spreads of the specific parent companies,
adjusted to reflect subsidiaries’ credit ratings relative to their parent company. The additional spread over LIBOR incorporated
into the discount rate was 10 to 110 basis points for the GMIB liability and 0 to 140 basis points for the GMIB reinsurance asset
for that portion of the interest rate curve most relevant to these policies.
x The risk and profit charge assumption is based on the Company’s estimate of the capital and return on capital that would be
required by a hypothetical market participant.
The Company regularly evaluates each of the assumptions used in establishing these assets and liabilities by considering how a
hypothetical market participant would set assumptions at each valuation date. Capital markets assumptions are expected to change at
each valuation date reflecting current observable market conditions. Other assumptions may also change based on a hypothetical
market participant’s view of actual experience as it emerges over time or other factors that impact the net liability. If the emergence of
future experience or future assumptions differs from the assumptions used in estimating these assets and liabilities, the resulting
impact could be material to the Company’s consolidated results of operations, and in certain situations, could be material to the
Company’s financial condition.