Cigna 2009 Annual Report Download - page 90
Download and view the complete annual report
Please find page 90 of the 2009 Cigna annual report below. You can navigate through the pages in the report by either clicking on the pages listed below, or by using the keyword search tool below to find specific information within the annual report.70
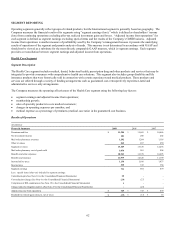
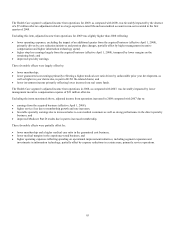
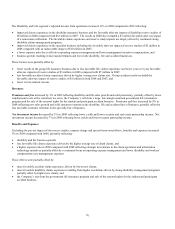
The Disability and Life segment’s adjusted income from operations increased 11% in 2008 compared to 2007 reflecting:
x improved claims experience in the disability insurance business and the favorable after-tax impact of disability reserve studies of
$8 million in 2008 compared with $12 million in 2007. The results in 2008 also included a $3 million favorable after-tax impact
of a reinsurance settlement. The favorable claims experience and reserve study impacts are largely driven by continued strong
disability claims management programs;
x improved claims experience in the specialty business including the favorable after-tax impact of reserve studies of $2 million in
2008 compared with an unfavorable impact of $10 million in 2007;
x a lower expense ratio due to effective operating expense management and lower management incentive compensation; and
x business growth resulting in increased premiums and fees in the disability, life and accident businesses.
These factors were partially offset by:
x lower results in the group life insurance business due to less favorable life claims experience and lower year over year favorable
after-tax impacts of reserve studies of $3 million in 2008 compared with $7 million in 2007;
x less favorable accident claims experience driven by higher average new claims size. Group accident results included the
favorable after-tax impact of reserve studies of $3 million in both 2008 and 2007; and
x lower net investment income.
Revenues
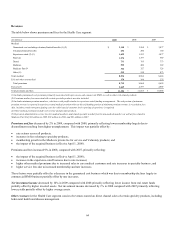
Premiums and fees increased by 3% in 2009 reflecting disability and life sales growth and solid persistency, partially offset by lower
employment levels at the customers we serve, the Company’s exit from a large, low-margin assumed government life reinsurance
program and the sale of the renewal rights for the student and participant accident business. Premiums and fees increased by 8% in
2008 reflecting new sales growth and solid customer retention in the disability, life and accident lines of business, partially offset by
less favorable customer retention in the specialty line of business.
Net investment income decreased by 5% in 2009 reflecting lower yields and lower security and real estate partnership income. Net
investment income decreased by 7% in 2008 reflecting lower yields and lower security partnership income.
Benefits and Expenses
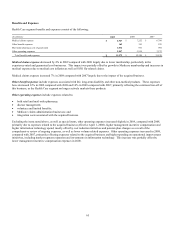
Excluding the pre-tax impact of the reserve studies, expense charge and special items noted above, benefits and expenses increased
3% in 2009 compared with 2008, primarily reflecting:
x disability and life business growth;
x less favorable life claims experience driven by the higher average size of death claims; and
x a higher expense ratio in 2009 compared with 2008 reflecting strategic investments in the claim operations and information
technology initiatives partially offset by a continued focus on operating expense management and lower disability and workers’
compensation case management expenses.
These effects were partially offset by:
x more favorable accident claim experience, driven by lower new claims;
x more favorable disability claims experience resulting from higher resolutions driven by strong disability management programs
partially offset by higher new claims; and
x the Company’s exit from the government life insurance program and sale of the renewal rights for the student and participant
accident business.


