Cigna 2009 Annual Report Download - page 150
Download and view the complete annual report
Please find page 150 of the 2009 Cigna annual report below. You can navigate through the pages in the report by either clicking on the pages listed below, or by using the keyword search tool below to find specific information within the annual report.-
 1
1 -
2
-
3
-
4
-
5
-
6
-
7
-
8
-
9
-
10
-
11
-
12
-
13
-
14
-
15
-
16
-
17
-
18
-
19
-
20
-
21
-
22
-
23
-
24
-
25
-
26
-
27
-
28
-
29
-
30
-
31
-
32
-
33
-
34
-
35
-
36
-
37
-
38
-
39
-
40
-
41
-
42
-
43
-
44
-
45
-
46
-
47
-
48
-
49
-
50
-
51
-
52
-
53
-
54
-
55
-
56
-
57
-
58
-
59
-
60
-
61
-
62
-
63
-
64
-
65
-
66
-
67
-
68
-
69
-
70
-
71
-
72
-
73
-
74
-
75
-
76
-
77
-
78
-
79
-
80
-
81
-
82
-
83
-
84
-
85
-
86
-
87
-
88
-
89
-
90
-
91
-
92
-
93
-
94
-
95
-
96
-
97
-
98
-
99
-
100
-
101
-
102
-
103
-
104
-
105
-
106
-
107
-
108
-
109
-
110
-
111
-
112
-
113
-
114
-
115
-
116
-
117
-
118
-
119
-
120
-
121
-
122
-
123
-
124
-
125
-
126
-
127
-
128
-
129
-
130
-
131
-
132
-
133
-
134
-
135
-
136
-
137
-
138
-
139
-
 140
140 -
 141
141 -
 142
142 -
 143
143 -
 144
144 -
 145
145 -
 146
146 -
 147
147 -
 148
148 -
 149
149 -
 150
150 -
 151
151 -
 152
152 -
 153
153 -
 154
154 -
 155
155 -
 156
156 -
 157
157 -
 158
158 -
 159
159 -
 160
160 -
161
-
162
-
163
-
164
-
165
-
166
-
167
-
168
-
169
-
170
-
171
-
172
-
173
-
174
-
175
-
176
-
177
-
178
-
179
-
180
-
181
-
182
-
183
-
184
-
185
-
186
-
187
-
188
-
189
-
190
-
191
-
192
-
193
-
194
-
195
-
196
-
197
-
198
-
199
-
200
-
201
-
202
-
203
-
204
-
205
-
206
-
207
-
208
-
209
-
210
-
211
-
212
-
213
-
214
-
215
-
216
-
217
-
218
-
219
-
220
-
221
-
222
-
223
-
224
-
225
-
226
-
227
-
228
 |
 |

130
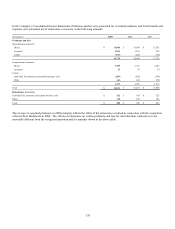
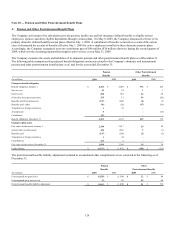
Plan assets in Level 1 include exchange-listed equity securities. Level 2 assets primarily include:
x fixed income and international equity funds priced using their daily net asset value which is the exit price; and
x fixed maturities valued using recent trades of similar securities or pricing models as described below.
Because many fixed maturities do not trade daily, fair values are often derived using recent trades of securities with similar features
and characteristics. When recent trades are not available, pricing models are used to determine these prices. These models calculate
fair values by discounting future cash flows at estimated market interest rates. Such market rates are derived by calculating the
appropriate spreads over comparable U.S. Treasury securities, based on the credit quality, industry and structure of the asset.
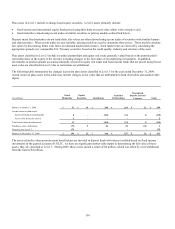
Plan assets classified in Level 3 include securities partnerships and equity real estate generally valued based on the pension plan’s
ownership share of the equity of the investee including changes in the fair values of its underlying investments. In addition,
investments in pooled separate accounts principally invested in equity real estate and fixed income funds that are priced using the net
asset value are classified in Level 3 due to restrictions on withdrawal.
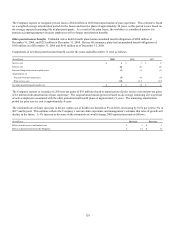
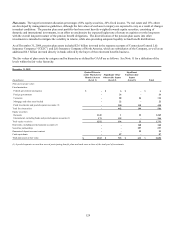
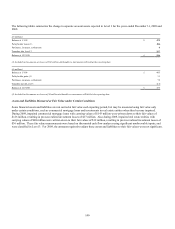
The following table summarizes the changes in pension plan assets classified in Level 3 for the year ended December 31, 2009.
Actual return on plan assets in this table may include changes in fair value that are attributable to both observable and unobservable
inputs.
(In millions)
Fixed
Maturities
Equity
Securities Real Estate
Securities
Partnerships
Guaranteed
Deposit Account
Contract Total
Balance at January 1, 2009 $ 31 $ 14 $ 208 $ 264 $ 32 $ 549
Actual return on plan assets: -
Assets still held at reporting date 8 - (104) (31) 8 (119)
Assets sold during the period 5 - - - - 5
Total actual return on plan assets 13 - (104) (31) 8 (114)
Purchases, sales, settlements (75) 9 56 24 (11) 3
Transfers into Level 3 175 - - - - 175
Balance at December 31, 2009 $ 144 $ 23 $ 160 $ 257 $ 29 $ 613
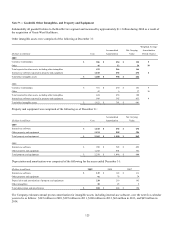
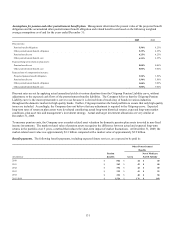
The assets related to other postretirement benefit plans are invested in deposit funds with interest credited based on fixed income
investments in the general account of CGLIC. As there are significant unobservable inputs in determining the fair value of these
assets, they are classified as Level 3. During 2009, these assets earned a return of $2 million, which was offset by a net withdrawal
from the fund of $2 million.