Cigna 2009 Annual Report Download - page 139
Download and view the complete annual report
Please find page 139 of the 2009 Cigna annual report below. You can navigate through the pages in the report by either clicking on the pages listed below, or by using the keyword search tool below to find specific information within the annual report.-
 1
1 -
2
-
3
-
4
-
5
-
6
-
7
-
8
-
9
-
10
-
11
-
12
-
13
-
14
-
15
-
16
-
17
-
18
-
19
-
20
-
21
-
22
-
23
-
24
-
25
-
26
-
27
-
28
-
29
-
30
-
31
-
32
-
33
-
34
-
35
-
36
-
37
-
38
-
39
-
40
-
41
-
42
-
43
-
44
-
45
-
46
-
47
-
48
-
49
-
50
-
51
-
52
-
53
-
54
-
55
-
56
-
57
-
58
-
59
-
60
-
61
-
62
-
63
-
64
-
65
-
66
-
67
-
68
-
69
-
70
-
71
-
72
-
73
-
74
-
75
-
76
-
77
-
78
-
79
-
80
-
81
-
82
-
83
-
84
-
85
-
86
-
87
-
88
-
89
-
90
-
91
-
92
-
93
-
94
-
95
-
96
-
97
-
98
-
99
-
100
-
101
-
102
-
103
-
104
-
105
-
106
-
107
-
108
-
109
-
110
-
111
-
112
-
113
-
114
-
115
-
116
-
117
-
118
-
119
-
120
-
121
-
122
-
123
-
124
-
125
-
126
-
127
-
128
-
 129
129 -
 130
130 -
 131
131 -
 132
132 -
 133
133 -
 134
134 -
 135
135 -
 136
136 -
 137
137 -
 138
138 -
 139
139 -
 140
140 -
 141
141 -
 142
142 -
 143
143 -
 144
144 -
 145
145 -
 146
146 -
 147
147 -
 148
148 -
 149
149 -
150
-
151
-
152
-
153
-
154
-
155
-
156
-
157
-
158
-
159
-
160
-
161
-
162
-
163
-
164
-
165
-
166
-
167
-
168
-
169
-
170
-
171
-
172
-
173
-
174
-
175
-
176
-
177
-
178
-
179
-
180
-
181
-
182
-
183
-
184
-
185
-
186
-
187
-
188
-
189
-
190
-
191
-
192
-
193
-
194
-
195
-
196
-
197
-
198
-
199
-
200
-
201
-
202
-
203
-
204
-
205
-
206
-
207
-
208
-
209
-
210
-
211
-
212
-
213
-
214
-
215
-
216
-
217
-
218
-
219
-
220
-
221
-
222
-
223
-
224
-
225
-
226
-
227
-
228
 |
 |
119
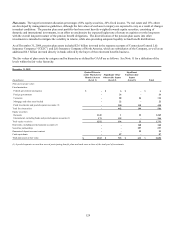
The following provides information about the Company’s reserving methodology and assumptions for GMDB as of December 31,
2009:
x The reserves represent estimates of the present value of net amounts expected to be paid, less the present value of net future
premiums. Included in net amounts expected to be paid is the excess of the guaranteed death benefits over the values of the
contractholders’ accounts (based on underlying equity and bond mutual fund investments).
x The reserves include an estimate for partial surrenders that essentially lock in the death benefit for a particular policy based on
annual election rates that vary from 0-22% depending on the net amount at risk for each policy and whether surrender charges
apply.
x The assumed mean investment performance for the underlying equity mutual funds considers the Company’s GMDB equity
hedge program using futures contracts, and is based on the Company’s view that short-term interest rates will average 5% over
future periods, but considers that current short-term rates are less than 5%. The mean investment performance assumption for the
underlying fixed income mutual funds (bonds and money market) is 5% based on a review of historical returns. The investment
performance for underlying equity and fixed income mutual funds is reduced by fund fees ranging from 1-3% across all
funds. The results of futures contracts are reflected in the liability calculation as a component of investment returns.
x The volatility assumption is based on a review of historical monthly returns for each key index (e.g. S&P 500) over a period of at
least ten years. Volatility represents the dispersion of historical returns compared to the average historical return (standard
deviation) for each index. The assumption is 16-30%, varying by equity fund type; 4-10%, varying by bond fund type; and 2%
for money market funds. These volatility assumptions are used along with the mean investment performance assumption to
project future return scenarios.
x The discount rate is 5.75%.
x The mortality assumption is 70-75% of the 1994 Group Annuity Mortality table, with 1% annual improvement beginning January
1, 2000.
x The lapse rate assumption is 0-21%, depending on contract type, policy duration and the ratio of the net amount at risk to account
value.
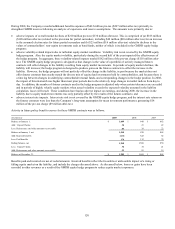
Although first quarter 2009 results included reserve strengthening of $73 million pre-tax ($47 million after-tax), no additional reserve
strengthening was required since then, primarily due to the stabilization and recovery of equity markets. The components of the first
quarter reserve strengthening were:
x adverse impacts of overall market declines of $50 million pre-tax ($32 million after-tax). This is comprised of (a) $39 million
pre-tax ($25 million after-tax) primarily related to the provision for future partial surrenders, and (b) $11 million pre-tax ($7
million after-tax) related to declines in the values of contractholders’ non-equity investments such as bond funds, neither of which
is included in the GMDB equity hedge program;
x adverse volatility-related impacts of $11 million pre-tax ($7 million after-tax) due to turbulent equity market conditions, including
higher than expected claims and the performance of the diverse mix of equity fund investments held by contractholders being
different than expected; and
x adverse interest rate impacts of $12 million pre-tax ($8 million after-tax). Interest rate risk is not covered by the GMDB equity
hedge program, and the interest rate returns on the futures contracts were less than the Company’s long-term assumption for mean
investment performance.