Cigna 2009 Annual Report Download - page 154
Download and view the complete annual report
Please find page 154 of the 2009 Cigna annual report below. You can navigate through the pages in the report by either clicking on the pages listed below, or by using the keyword search tool below to find specific information within the annual report.-
 1
1 -
2
-
3
-
4
-
5
-
6
-
7
-
8
-
9
-
10
-
11
-
12
-
13
-
14
-
15
-
16
-
17
-
18
-
19
-
20
-
21
-
22
-
23
-
24
-
25
-
26
-
27
-
28
-
29
-
30
-
31
-
32
-
33
-
34
-
35
-
36
-
37
-
38
-
39
-
40
-
41
-
42
-
43
-
44
-
45
-
46
-
47
-
48
-
49
-
50
-
51
-
52
-
53
-
54
-
55
-
56
-
57
-
58
-
59
-
60
-
61
-
62
-
63
-
64
-
65
-
66
-
67
-
68
-
69
-
70
-
71
-
72
-
73
-
74
-
75
-
76
-
77
-
78
-
79
-
80
-
81
-
82
-
83
-
84
-
85
-
86
-
87
-
88
-
89
-
90
-
91
-
92
-
93
-
94
-
95
-
96
-
97
-
98
-
99
-
100
-
101
-
102
-
103
-
104
-
105
-
106
-
107
-
108
-
109
-
110
-
111
-
112
-
113
-
114
-
115
-
116
-
117
-
118
-
119
-
120
-
121
-
122
-
123
-
124
-
125
-
126
-
127
-
128
-
129
-
130
-
131
-
132
-
133
-
134
-
135
-
136
-
137
-
138
-
139
-
140
-
141
-
142
-
143
-
 144
144 -
 145
145 -
 146
146 -
 147
147 -
 148
148 -
 149
149 -
 150
150 -
 151
151 -
 152
152 -
 153
153 -
 154
154 -
 155
155 -
 156
156 -
 157
157 -
 158
158 -
 159
159 -
 160
160 -
 161
161 -
 162
162 -
 163
163 -
 164
164 -
165
-
166
-
167
-
168
-
169
-
170
-
171
-
172
-
173
-
174
-
175
-
176
-
177
-
178
-
179
-
180
-
181
-
182
-
183
-
184
-
185
-
186
-
187
-
188
-
189
-
190
-
191
-
192
-
193
-
194
-
195
-
196
-
197
-
198
-
199
-
200
-
201
-
202
-
203
-
204
-
205
-
206
-
207
-
208
-
209
-
210
-
211
-
212
-
213
-
214
-
215
-
216
-
217
-
218
-
219
-
220
-
221
-
222
-
223
-
224
-
225
-
226
-
227
-
228
 |
 |

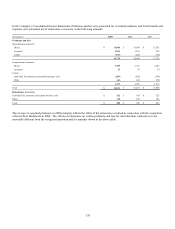
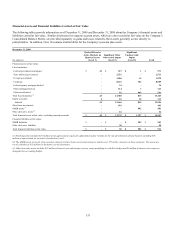
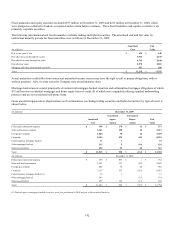
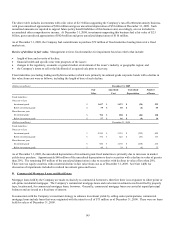
134
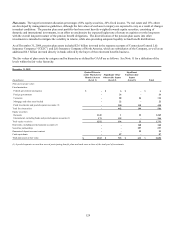
December 31, 2008
(In millions)
Quoted Prices in
Active Markets for
Identical Assets
(Level 1)
Significant Other
Observable Inputs
(Level 2)
Significant
Unobservable
Inputs
(Level 3) Total
Financial assets at fair value:
Fixed maturities:
Federal government and agency $ 38 $ 724 $ - $ 762
State and local government - 2,486 - 2,486
Foreign government - 923 21 944
Corporate - 6,526 330 6,856
Federal agency mortgage-backed - 37 - 37
Other mortgage-backed - 121 4 125
Other asset-backed - 57 514 571
Total fixed maturities (1) 38 10,874 869 11,781
Equity securities 8 84 20 112
Subtotal 46 10,958 889 11,893
Short-term investments - 236 - 236
GMIB assets (2) - - 953 953
Other derivative assets (3) - 45 - 45
Total financial assets at fair value, excluding separate accounts $ 46 $ 11,239 $ 1,842 $ 13,127
Financial liabilities at fair value:
GMIB liabilities $ - $ - $ 1,757 $ 1,757
Other derivative liabilities - 36 - 36
Total financial liabilities at fair value $ - $ 36 $ 1,757 $ 1,793
(1) Fixed maturities includes $514 million of net appreciation required to adjust future policy benefits for the run-off settlement annuity business including $111
million of appreciation for securities classified in Level 3.
(2) The GMIB assets represent retrocessional contracts in place from two external reinsurers which cover 55% of the exposures on these contracts. The assets are
net of a liability of $17 million for the future cost of reinsurance.
(3) Other derivative assets include $40 million of interest rate and foreign currency swaps qualifying as cash flow hedges and $5 million of interest rate swaps not
designated as accounting hedges.
Level 1 Financial Assets
Assets in Level 1 include actively-traded U.S. government bonds and exchange-listed equity securities. Given the narrow definition
of Level 1 and the Company's investment asset strategy to maximize investment returns, a relatively small portion of the Company’s
investment assets are classified in this category.
Level 2 Financial Assets and Financial Liabilities
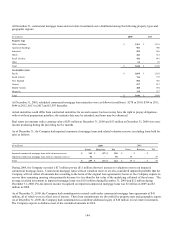
Fixed maturities and equity securities. Approximately 93% as of December 31, 2009 and 92% as of December 31, 2008 of the
Company’s investments in fixed maturities and equity securities are classified in Level 2 including most public and private corporate
debt and equity securities, federal agency and municipal bonds, non-government mortgage and asset-backed securities and preferred
stocks. Because many fixed maturities and preferred stocks do not trade daily, fair values are often derived using recent trades of
securities with similar features and characteristics. When recent trades are not available, pricing models are used to determine these
prices. These models calculate fair values by discounting future cash flows at estimated market interest rates. Such market rates are
derived by calculating the appropriate spreads over comparable U.S. Treasury securities, based on the credit quality, industry and
structure of the asset.
Typical inputs and assumptions to pricing models include, but are not limited to, benchmark yields, reported trades, broker-dealer
quotes, issuer spreads, liquidity, benchmark securities, bids, offers, reference data, and industry and economic events. For mortgage
and asset-backed securities, inputs and assumptions may also include characteristics of the issuer, collateral attributes, prepayment
speeds and credit rating.