Cigna 2009 Annual Report Download - page 67
Download and view the complete annual report
Please find page 67 of the 2009 Cigna annual report below. You can navigate through the pages in the report by either clicking on the pages listed below, or by using the keyword search tool below to find specific information within the annual report.-
 1
1 -
2
-
3
-
4
-
5
-
6
-
7
-
8
-
9
-
10
-
11
-
12
-
13
-
14
-
15
-
16
-
17
-
18
-
19
-
20
-
21
-
22
-
23
-
24
-
25
-
26
-
27
-
28
-
29
-
30
-
31
-
32
-
33
-
34
-
35
-
36
-
37
-
38
-
39
-
40
-
41
-
42
-
43
-
44
-
45
-
46
-
47
-
48
-
49
-
50
-
51
-
52
-
53
-
54
-
55
-
56
-
 57
57 -
 58
58 -
 59
59 -
 60
60 -
 61
61 -
 62
62 -
 63
63 -
 64
64 -
 65
65 -
 66
66 -
 67
67 -
 68
68 -
 69
69 -
 70
70 -
 71
71 -
 72
72 -
 73
73 -
 74
74 -
 75
75 -
 76
76 -
 77
77 -
78
-
79
-
80
-
81
-
82
-
83
-
84
-
85
-
86
-
87
-
88
-
89
-
90
-
91
-
92
-
93
-
94
-
95
-
96
-
97
-
98
-
99
-
100
-
101
-
102
-
103
-
104
-
105
-
106
-
107
-
108
-
109
-
110
-
111
-
112
-
113
-
114
-
115
-
116
-
117
-
118
-
119
-
120
-
121
-
122
-
123
-
124
-
125
-
126
-
127
-
128
-
129
-
130
-
131
-
132
-
133
-
134
-
135
-
136
-
137
-
138
-
139
-
140
-
141
-
142
-
143
-
144
-
145
-
146
-
147
-
148
-
149
-
150
-
151
-
152
-
153
-
154
-
155
-
156
-
157
-
158
-
159
-
160
-
161
-
162
-
163
-
164
-
165
-
166
-
167
-
168
-
169
-
170
-
171
-
172
-
173
-
174
-
175
-
176
-
177
-
178
-
179
-
180
-
181
-
182
-
183
-
184
-
185
-
186
-
187
-
188
-
189
-
190
-
191
-
192
-
193
-
194
-
195
-
196
-
197
-
198
-
199
-
200
-
201
-
202
-
203
-
204
-
205
-
206
-
207
-
208
-
209
-
210
-
211
-
212
-
213
-
214
-
215
-
216
-
217
-
218
-
219
-
220
-
221
-
222
-
223
-
224
-
225
-
226
-
227
-
228
 |
 |

47
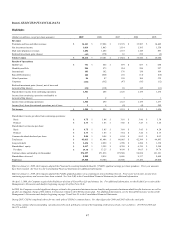
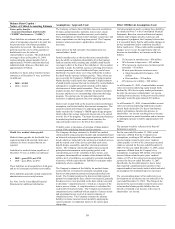
Item 6. SELECTED FINANCIAL DATA
Highlights
(Dollars in millions, except per share amounts) 2009 2008 2007 2006 2005
Revenues
Premiums and fees and other revenues $ 16,161 $ 17,004 $ 15,376 $ 13,987 $ 14,449
Net investment income 1,014 1,063 1,114 1,195 1,358
Mail order pharmacy revenues 1,282 1,204 1,118 1,145 883
Realized investment gains (losses) (43) (170) 16 219 (6)
Total revenues $ 18,414 $ 19,101 $ 17,624 $ 16,546 $ 16,684
Results of Operations:
Health Care $ 731 $ 664 $ 679 $ 653 $ 688
Disability and Life 284 273 254 226 227
International 183 182 176 138 109
Run-off Reinsurance 185 (646) (11) (14) (64)
Other Operations 86 87 109 106 339
Corporate (142) (162) (97) (95) (12)
Realized investment gains (losses), net of taxes and
noncontrolling interest (26) (110) 10 145 (11)
Shareholders' income from continuing operations 1,301 288 1,120 1,159 1,276
Income from continuing operations attributable to
noncontrolling interest 3 2 3 - 1
Income from continuing operations 1,304 290 1,123 1,159 1,277
Income (loss) from discontinued operations, net of taxes 1 4 (5) (4) 349
Net income $ 1,305 $ 294 $ 1,118 $ 1,155 $ 1,626
Shareholders' income per share from continuing operations:
Basic $ 4.75 $ 1.04 $ 3.91 $ 3.46 $ 3.30
Diluted $ 4.73 $ 1.03 $ 3.86 $ 3.43 $ 3.26
Shareholders' net income per share:
Basic $ 4.75 $ 1.05 $ 3.89 $ 3.45 $ 4.20
Diluted $ 4.73 $ 1.05 $ 3.84 $ 3.42 $ 4.15
Common dividends declared per share $ 0.04 $ 0.04 $ 0.04 $ 0.03 $ 0.03
Total assets $ 43,013 $ 41,406 $ 40,065 $ 42,399 $ 44,893
Long-term debt $ 2,436 $ 2,090 $ 1,790 $ 1,294 $ 1,338
Shareholders’ equity $ 5,417 $ 3,592 $ 4,748 $ 4,330 $ 5,360
Per share $ 19.75 $ 13.25 $ 16.98 $ 14.63 $ 14.74
Common shares outstanding (in thousands) 274,257 271,036 279,588 98,654 121,191
Shareholders of record 8,888 9,014 8,696 9,117 9,440
Employees 29,300 30,300 26,600 27,100 28,000
Effective January 1, 2009, the Company adopted the Financial Accounting Standards Board's ("FASB") updated earnings per share guidance. Prior year amounts
have been restated. See Note 4 to the Consolidated Financial Statements for additional information.
Effective January 1, 2009, the Company adopted the FASB's updated guidance on accounting for noncontrolling interests. Prior years' net income, income from
continuing operations, and revenues have been restated. See Note 2(B) to the Consolidated Financial Statements for additional information.
On April 1, 2008, the Company acquired the Healthcare division of Great-West Life and Annuity, Inc. For additional information, see the Health Care section of the
Management’s Discussion and Analysis beginning on page 62 of this Form 10-K.
In 2008, the Company recorded significant charges related to the guaranteed minimum income benefits and guaranteed minimum death benefits businesses as well as
an after-tax litigation charge of $52 million in Corporate related to the CIGNA pension plan. For additional information, see the Run-off Reinsurance section of the
Management’s Discussion and Analysis beginning on page 73 and Note 23 to the Consolidated Financial Statements.
During 2007, CIGNA completed a three-for-one stock split of CIGNA's common shares. Per share figures for 2006 and 2005 reflect the stock split.
Pro forma common shares outstanding, calculated as if the stock split had occurred at the beginning of the prior periods, were as follows: 295,963 in 2006 and
363,573 in 2005.