Cigna 2009 Annual Report Download - page 83
Download and view the complete annual report
Please find page 83 of the 2009 Cigna annual report below. You can navigate through the pages in the report by either clicking on the pages listed below, or by using the keyword search tool below to find specific information within the annual report.-
 1
1 -
2
-
3
-
4
-
5
-
6
-
7
-
8
-
9
-
10
-
11
-
12
-
13
-
14
-
15
-
16
-
17
-
18
-
19
-
20
-
21
-
22
-
23
-
24
-
25
-
26
-
27
-
28
-
29
-
30
-
31
-
32
-
33
-
34
-
35
-
36
-
37
-
38
-
39
-
40
-
41
-
42
-
43
-
44
-
45
-
46
-
47
-
48
-
49
-
50
-
51
-
52
-
53
-
54
-
55
-
56
-
57
-
58
-
59
-
60
-
61
-
62
-
63
-
64
-
65
-
66
-
67
-
68
-
69
-
70
-
71
-
72
-
 73
73 -
 74
74 -
 75
75 -
 76
76 -
 77
77 -
 78
78 -
 79
79 -
 80
80 -
 81
81 -
 82
82 -
 83
83 -
 84
84 -
 85
85 -
 86
86 -
 87
87 -
 88
88 -
 89
89 -
 90
90 -
 91
91 -
 92
92 -
 93
93 -
94
-
95
-
96
-
97
-
98
-
99
-
100
-
101
-
102
-
103
-
104
-
105
-
106
-
107
-
108
-
109
-
110
-
111
-
112
-
113
-
114
-
115
-
116
-
117
-
118
-
119
-
120
-
121
-
122
-
123
-
124
-
125
-
126
-
127
-
128
-
129
-
130
-
131
-
132
-
133
-
134
-
135
-
136
-
137
-
138
-
139
-
140
-
141
-
142
-
143
-
144
-
145
-
146
-
147
-
148
-
149
-
150
-
151
-
152
-
153
-
154
-
155
-
156
-
157
-
158
-
159
-
160
-
161
-
162
-
163
-
164
-
165
-
166
-
167
-
168
-
169
-
170
-
171
-
172
-
173
-
174
-
175
-
176
-
177
-
178
-
179
-
180
-
181
-
182
-
183
-
184
-
185
-
186
-
187
-
188
-
189
-
190
-
191
-
192
-
193
-
194
-
195
-
196
-
197
-
198
-
199
-
200
-
201
-
202
-
203
-
204
-
205
-
206
-
207
-
208
-
209
-
210
-
211
-
212
-
213
-
214
-
215
-
216
-
217
-
218
-
219
-
220
-
221
-
222
-
223
-
224
-
225
-
226
-
227
-
228
 |
 |
63
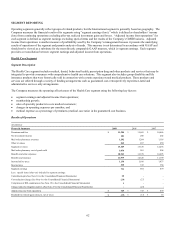
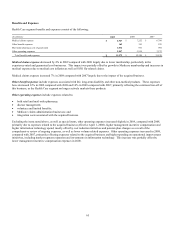
The Health Care segment’s adjusted income from operations for 2009, as compared with 2008, was favorably impacted by the absence
of a $7 million after-tax adjustment related to a large experience-rated life and non-medical account in run-out recorded in the first
quarter of 2008.
Excluding this item, adjusted income from operations for 2009 was slightly higher than 2008 reflecting:
x lower operating expenses, excluding the impact of an additional quarter from the acquired business (effective April 1, 2008),
primarily driven by cost reduction initiatives and pension plan changes, partially offset by higher management incentive
compensation and higher information technology spend;
x higher stop loss earnings largely from the acquired business (effective April 1, 2008), tempered by lower margins on the
remaining book; and
x improved specialty earnings.
These favorable effects were largely offset by:
x lower membership;
x lower guaranteed cost earnings primarily reflecting a higher medical care ratio driven by unfavorable prior year development, as
well as higher in-year claims due, in part to H1N1 flu-related claims; and
x lower investment income primarily reflecting lower income from real estate funds.
The Health Care segment’s adjusted income from operations in 2008, as compared with 2007, was favorably impacted by lower
management incentive compensation expense of $21 million after-tax.
Excluding the items mentioned above, adjusted income from operations increased in 2008 compared with 2007 due to:
x earnings from the acquired business (effective April 1, 2008);
x higher service fees due to membership growth and rate increases;
x favorable specialty earnings due to increased sales to core medical customers as well as strong performance in the direct specialty
business; and
x improved Medicare Part D results due in part to increased membership.
These favorable effects were partially offset by:
x lower membership and a higher medical care ratio in the guaranteed cost business;
x lower medical margins in the experience-rated business; and
x higher operating expenses reflecting spending on operational improvement initiatives, including segment expansion and
investments in information technology, partially offset by expense reductions in certain areas, primarily service operations.