Cigna 2009 Annual Report Download - page 148
Download and view the complete annual report
Please find page 148 of the 2009 Cigna annual report below. You can navigate through the pages in the report by either clicking on the pages listed below, or by using the keyword search tool below to find specific information within the annual report.-
 1
1 -
2
-
3
-
4
-
5
-
6
-
7
-
8
-
9
-
10
-
11
-
12
-
13
-
14
-
15
-
16
-
17
-
18
-
19
-
20
-
21
-
22
-
23
-
24
-
25
-
26
-
27
-
28
-
29
-
30
-
31
-
32
-
33
-
34
-
35
-
36
-
37
-
38
-
39
-
40
-
41
-
42
-
43
-
44
-
45
-
46
-
47
-
48
-
49
-
50
-
51
-
52
-
53
-
54
-
55
-
56
-
57
-
58
-
59
-
60
-
61
-
62
-
63
-
64
-
65
-
66
-
67
-
68
-
69
-
70
-
71
-
72
-
73
-
74
-
75
-
76
-
77
-
78
-
79
-
80
-
81
-
82
-
83
-
84
-
85
-
86
-
87
-
88
-
89
-
90
-
91
-
92
-
93
-
94
-
95
-
96
-
97
-
98
-
99
-
100
-
101
-
102
-
103
-
104
-
105
-
106
-
107
-
108
-
109
-
110
-
111
-
112
-
113
-
114
-
115
-
116
-
117
-
118
-
119
-
120
-
121
-
122
-
123
-
124
-
125
-
126
-
127
-
128
-
129
-
130
-
131
-
132
-
133
-
134
-
135
-
136
-
137
-
 138
138 -
 139
139 -
 140
140 -
 141
141 -
 142
142 -
 143
143 -
 144
144 -
 145
145 -
 146
146 -
 147
147 -
 148
148 -
 149
149 -
 150
150 -
 151
151 -
 152
152 -
 153
153 -
 154
154 -
 155
155 -
 156
156 -
 157
157 -
 158
158 -
159
-
160
-
161
-
162
-
163
-
164
-
165
-
166
-
167
-
168
-
169
-
170
-
171
-
172
-
173
-
174
-
175
-
176
-
177
-
178
-
179
-
180
-
181
-
182
-
183
-
184
-
185
-
186
-
187
-
188
-
189
-
190
-
191
-
192
-
193
-
194
-
195
-
196
-
197
-
198
-
199
-
200
-
201
-
202
-
203
-
204
-
205
-
206
-
207
-
208
-
209
-
210
-
211
-
212
-
213
-
214
-
215
-
216
-
217
-
218
-
219
-
220
-
221
-
222
-
223
-
224
-
225
-
226
-
227
-
228
 |
 |

128
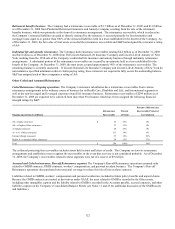
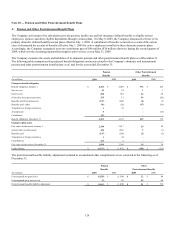
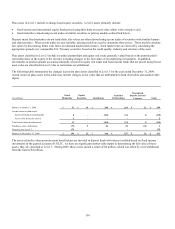
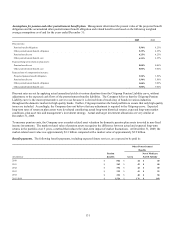
The Company expects to recognize pre-tax losses of $24 million in 2010 from amortization of past experience. This estimate is based
on a weighted average amortization period for the frozen and inactive plans of approximately 30 years, as this period is now based on
the average expected remaining life of plan participants. As a result of the plan freeze, the workforce is considered inactive for
pension accounting purposes because employees will no longer earn pension benefits.
Other postretirement benefits. Unfunded retiree health benefit plans had accumulated benefit obligations of $268 million at
December 31, 2009, and $235 million at December 31, 2008. Retiree life insurance plans had accumulated benefit obligations of
$150 million as of December 31, 2009 and $141 million as of December 31, 2008.
Components of net other postretirement benefit cost for the years ended December 31 were as follows:
(In millions) 2009 2008 2007
Service cost $ 1 $ 1 $ 2
Interest cost 24 24 24
Expected long-term return on plan assets (1) (1) (1)
Amortization of:
Net gain from past experience (5) (8) (6)
Prior service cost (18) (17) (17)
Net other postretirement benefit cost $ 1 $ (1) $ 2
The Company expects to recognize in 2010 pre-tax gains of $19 million related to amortization of prior service cost and pre-tax gains
of $1 million from amortization of past experience. The original amortization period is based on an average remaining service period
of active employees associated with the other postretirement benefit plans of approximately 9 years. The remaining amortization
period for prior service cost is approximately 4 years.
The estimated rate of future increases in the per capita cost of health care benefits is 9% in 2010, decreasing by 0.5% per year to 5% in
2017 and beyond. This estimate reflects the Company’s current claim experience and management’s estimate that rates of growth will
decline in the future. A 1% increase or decrease in the estimated rate would change 2009 reported amounts as follows:
(In millions) Increase Decrease
Effect on total service and interest cost $ 1 $ 1
Effect on postretirement benefit obligation $ 12 $ 11