Cigna 2009 Annual Report Download - page 73
Download and view the complete annual report
Please find page 73 of the 2009 Cigna annual report below. You can navigate through the pages in the report by either clicking on the pages listed below, or by using the keyword search tool below to find specific information within the annual report.-
 1
1 -
2
-
3
-
4
-
5
-
6
-
7
-
8
-
9
-
10
-
11
-
12
-
13
-
14
-
15
-
16
-
17
-
18
-
19
-
20
-
21
-
22
-
23
-
24
-
25
-
26
-
27
-
28
-
29
-
30
-
31
-
32
-
33
-
34
-
35
-
36
-
37
-
38
-
39
-
40
-
41
-
42
-
43
-
44
-
45
-
46
-
47
-
48
-
49
-
50
-
51
-
52
-
53
-
54
-
55
-
56
-
57
-
58
-
59
-
60
-
61
-
62
-
 63
63 -
 64
64 -
 65
65 -
 66
66 -
 67
67 -
 68
68 -
 69
69 -
 70
70 -
 71
71 -
 72
72 -
 73
73 -
 74
74 -
 75
75 -
 76
76 -
 77
77 -
 78
78 -
 79
79 -
 80
80 -
 81
81 -
 82
82 -
 83
83 -
84
-
85
-
86
-
87
-
88
-
89
-
90
-
91
-
92
-
93
-
94
-
95
-
96
-
97
-
98
-
99
-
100
-
101
-
102
-
103
-
104
-
105
-
106
-
107
-
108
-
109
-
110
-
111
-
112
-
113
-
114
-
115
-
116
-
117
-
118
-
119
-
120
-
121
-
122
-
123
-
124
-
125
-
126
-
127
-
128
-
129
-
130
-
131
-
132
-
133
-
134
-
135
-
136
-
137
-
138
-
139
-
140
-
141
-
142
-
143
-
144
-
145
-
146
-
147
-
148
-
149
-
150
-
151
-
152
-
153
-
154
-
155
-
156
-
157
-
158
-
159
-
160
-
161
-
162
-
163
-
164
-
165
-
166
-
167
-
168
-
169
-
170
-
171
-
172
-
173
-
174
-
175
-
176
-
177
-
178
-
179
-
180
-
181
-
182
-
183
-
184
-
185
-
186
-
187
-
188
-
189
-
190
-
191
-
192
-
193
-
194
-
195
-
196
-
197
-
198
-
199
-
200
-
201
-
202
-
203
-
204
-
205
-
206
-
207
-
208
-
209
-
210
-
211
-
212
-
213
-
214
-
215
-
216
-
217
-
218
-
219
-
220
-
221
-
222
-
223
-
224
-
225
-
226
-
227
-
228
 |
 |

53
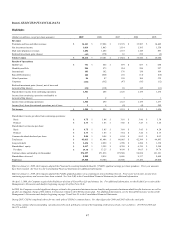
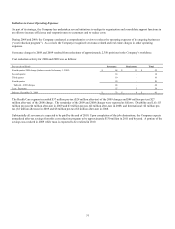
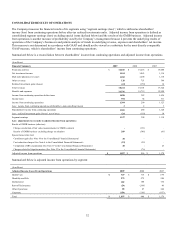
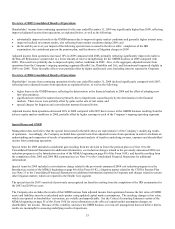
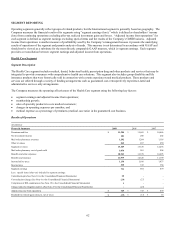
Overview of 2009 Consolidated Results of Operations
Shareholders’ income from continuing operations for the year ended December 31, 2009 was significantly higher than 2008, reflecting
improved adjusted income from operations, as explained below, as well as the following:
x substantially improved results in the GMIB business due to improved equity market conditions and generally higher interest rates;
x improved realized investment results, also reflecting better market conditions during 2009; and
x the favorable year over year impact of the following special items as noted in the above table: completion of the IRS
examination; the curtailment gain on the pension plan; and the absence of litigation charges in 2009.
Adjusted income from operations increased 16% in 2009 compared with 2008, primarily reflecting significantly improved results in
the Run-off Reinsurance segment due to a lower amount of reserve strengthening for the GMDB business in 2009 compared with
2008. This result was primarily due to improved equity market conditions in 2009. Also, in the aggregate, adjusted income from
operations from the Company’s ongoing operating segments (Health Care, Disability and Life, and International) improved slightly in
2009 over 2008. These favorable effects were partially offset by higher unallocated costs (including interest) reported in Corporate.
Overview of 2008 Consolidated Results of Operations
Shareholders’ income from continuing operations for the year ended December 31, 2008 declined significantly compared with 2007,
reflecting lower adjusted income from operations as explained below, as well as the following:
x higher losses in the GMIB business, reflecting the deterioration in the financial markets in 2008 and the effect of adopting new
fair value guidance;
x significant net realized investment losses primarily due to impairments caused largely by the deterioration in the financial
markets. These losses were partially offset by gains on the sale of real estate; and
x special charges for litigation and cost reduction matters discussed below.
Adjusted income from operations decreased 20% in 2008 compared with 2007 due to losses in the GMDB business resulting from the
adverse equity market conditions in 2008, partially offset by higher earnings in each of the Company’s ongoing operating segments.
Special Items and GMIB
Management does not believe that the special items noted in the table above are representative of the Company’s underlying results
of operations. Accordingly, the Company excluded these special items from adjusted income from operations in order to facilitate an
understanding and comparison of results of operations and permit analysis of trends in underlying revenue, expenses and shareholders’
income from continuing operations.
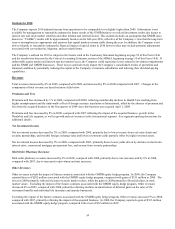
Special items for 2009 included a curtailment gain resulting from the decision to freeze the pension plan (see Note 10 to the
Consolidated Financial Statements for additional information), cost reduction charges related to the previously announced 2008 cost
reduction program (see the Introduction section of the MD&A beginning on page 48 of this Form 10-K), and benefits resulting from
the completion of the 2005 and 2006 IRS examinations (see Note 19 to the Consolidated Financial Statements for additional
information).
Special items for 2008 included a cost reduction charge related to the previously announced 2008 cost reduction program (see the
Introduction section of the MD&A beginning on page 48 of this Form 10-K), a litigation matter related to the CIGNA Pension Plan
(see Note 23 to the Consolidated Financial Statements for additional information) reported in Corporate and charges related to certain
other litigation matters, which are reported in the Health Care segment.
The special item for 2007 consisted of previously unrecognized tax benefits resulting from the completion of the IRS examination for
the 2003 and 2004 tax years.
The Company also excludes the results of the GMIB business from adjusted income from operations because the fair value of GMIB
assets and liabilities must be recalculated each quarter using updated capital market assumptions. The resulting changes in fair value,
which are reported in shareholders’ net income, are volatile and unpredictable. See the Critical Accounting Estimates section of the
MD&A beginning on page 55 of this Form 10-K for more information on the effect of capital market assumption changes on
shareholders’ net income. Because of this volatility, and since the GMIB business is in run-off, management does not believe that its
results are meaningful in assessing underlying results of operations.